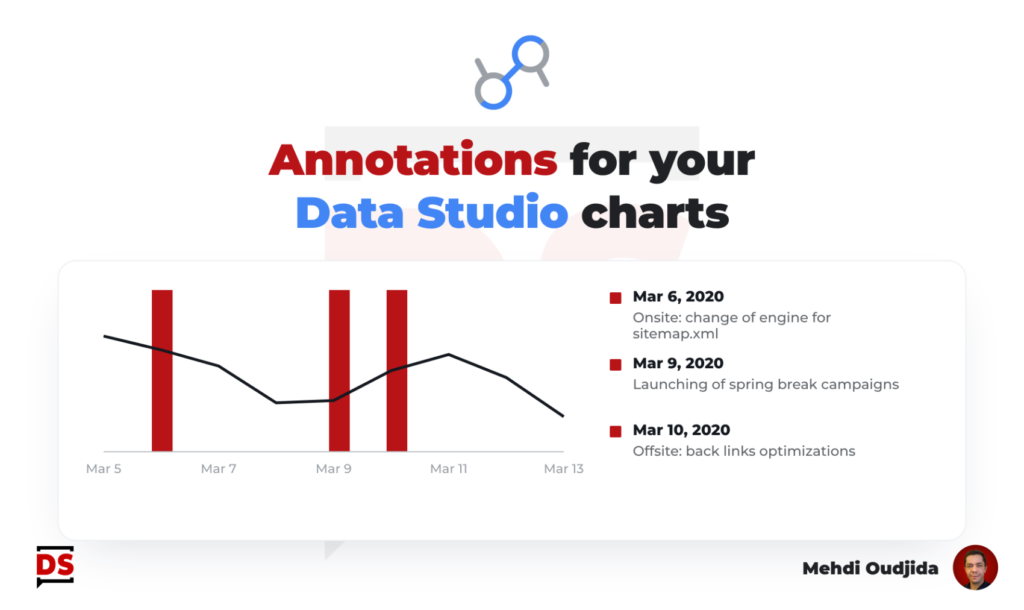
Few years ago, I wrote a tutorial about how we can include annotations inside Data Studio line charts. My custom solution was nice for instant events and correlation analysis.
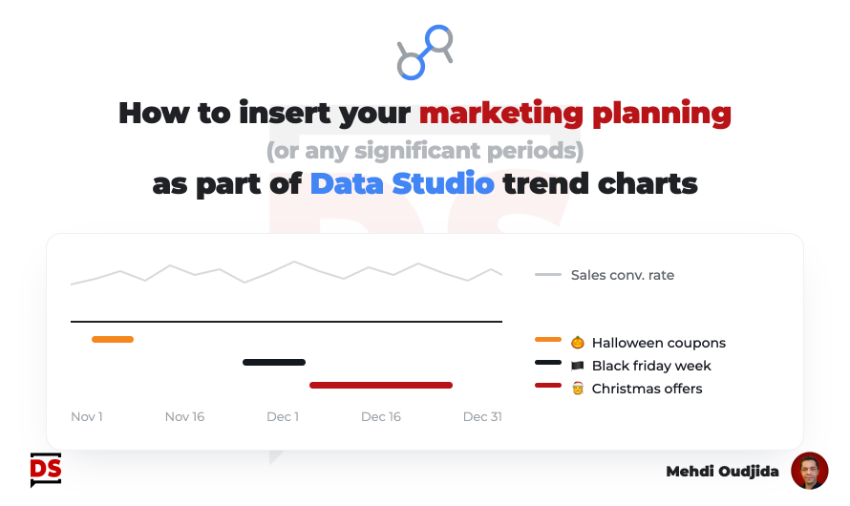
This time, we will take care about periods and events occurring during a date range.
As example, why not including a Gantt chart of a marketing/campaigns planning directly inside a trend chart of metric performance?
Unlock free access to the full article
Access to this article written by Mehdi Oudjida, Data Studio Expert, is completely free: enter your email address to receive an access link to the full article.
Your email address is only used to send the link, and for the newsletter if you tick the box. It is not stored on this site.