
Insight video clips with Gemini 3 for your standalone data story telling
A few months ago I created a just-for-fun report that displays product ranking data and track the associated volatility. At
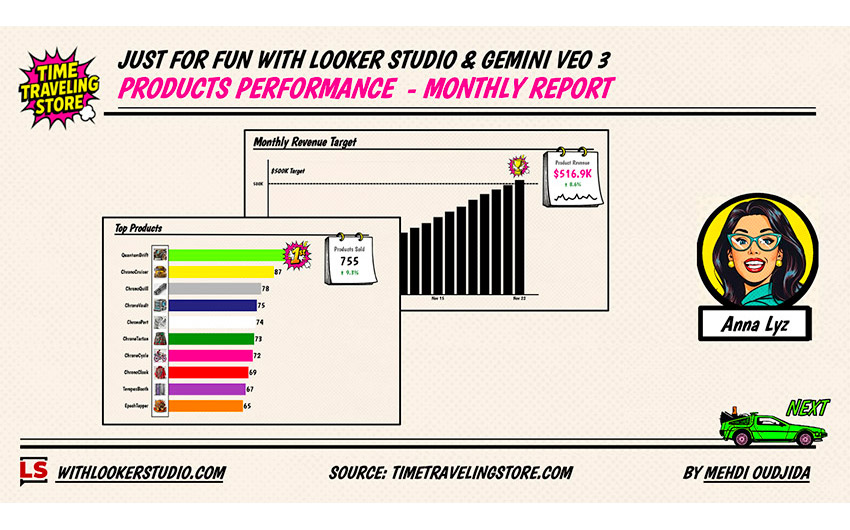
A few months ago I created a just-for-fun report that displays product ranking data and track the associated volatility. At
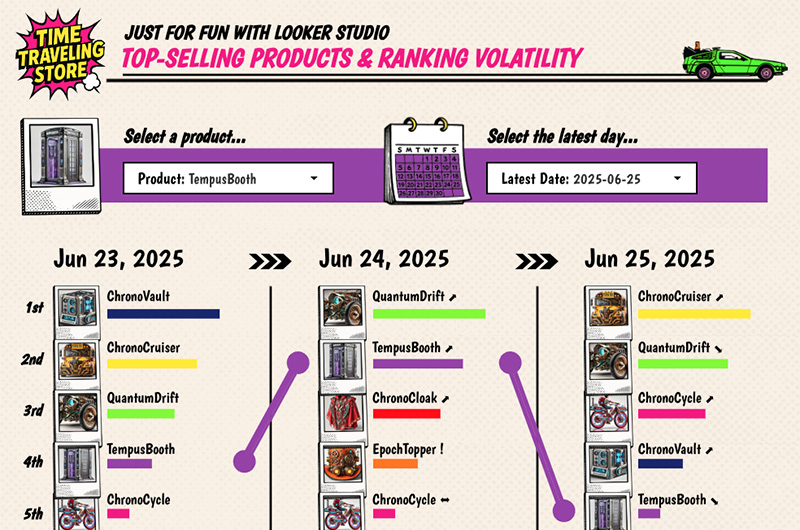
Here comes a new just-for-fun shared report designed with Looker Studio. This time, we are going to talk about visualisation
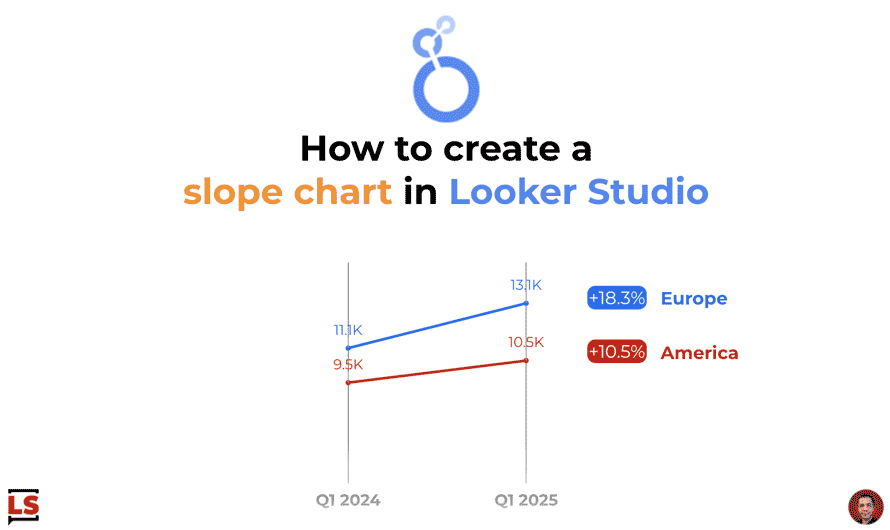
Let’s take advantage of the new style capabilities released yesterday to create a nicer slope chart than before with line
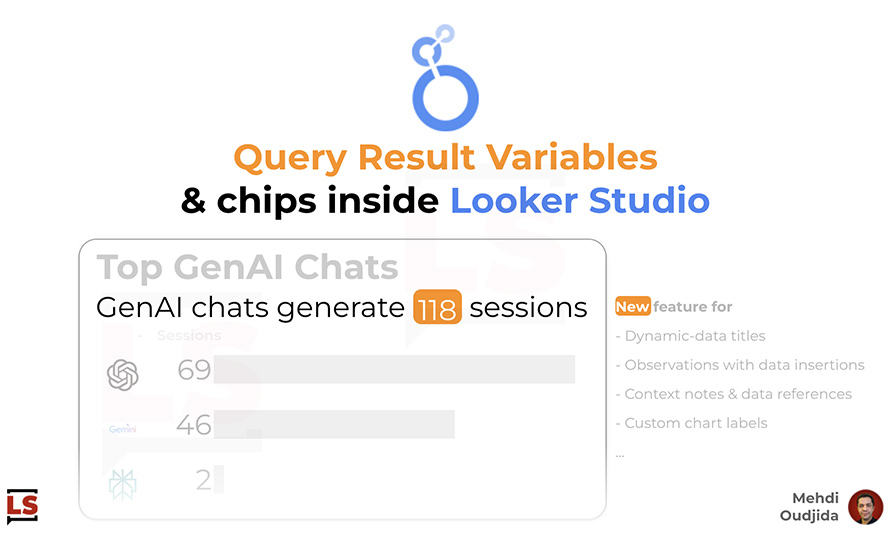
Let’s discover “Query Result Variables” or “Chips” inside Looker Studio, a freshly released feature at the same time than 2