
Ranking volatility & top-selling products: A just-for-fun shared report with Looker Studio
Here comes a new just-for-fun shared report designed with Looker Studio. This time, we are going to talk about visualisation
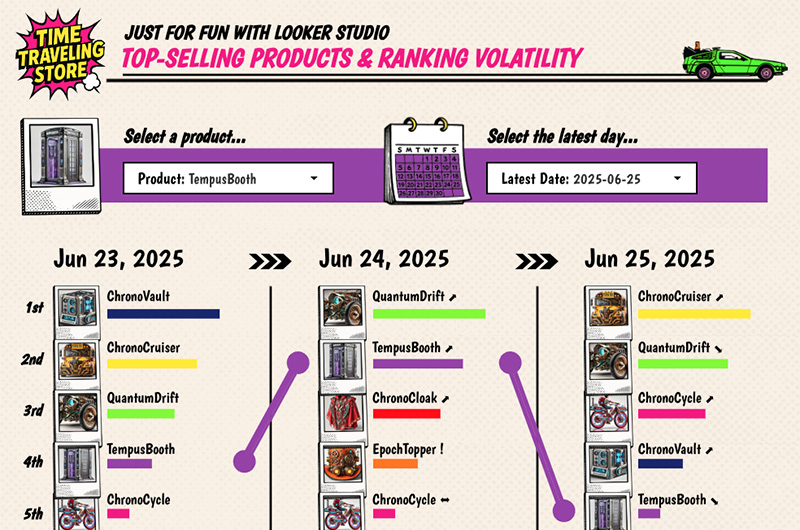
Here comes a new just-for-fun shared report designed with Looker Studio. This time, we are going to talk about visualisation
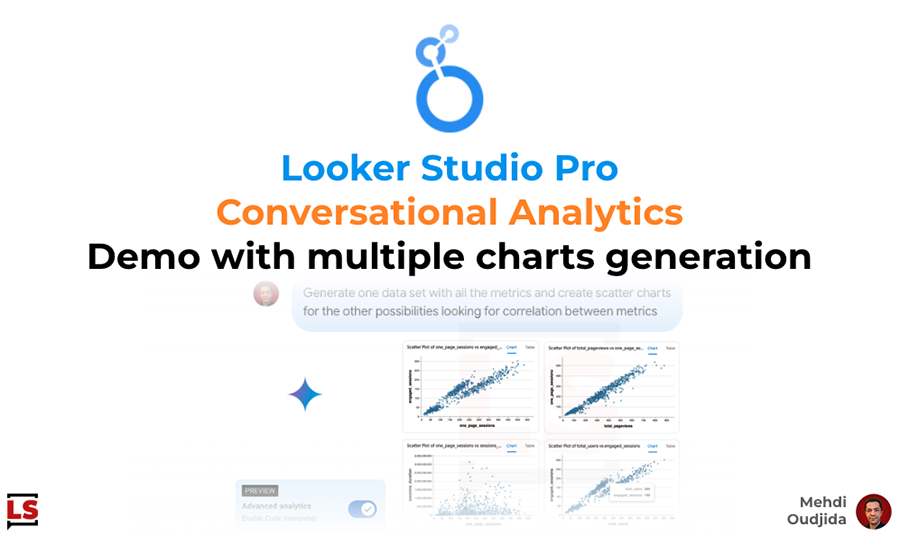
Ready to talk with your data? 🤌🏻 Here a new exciting demo of Looker Studio Pro Conversational Analytics – currently
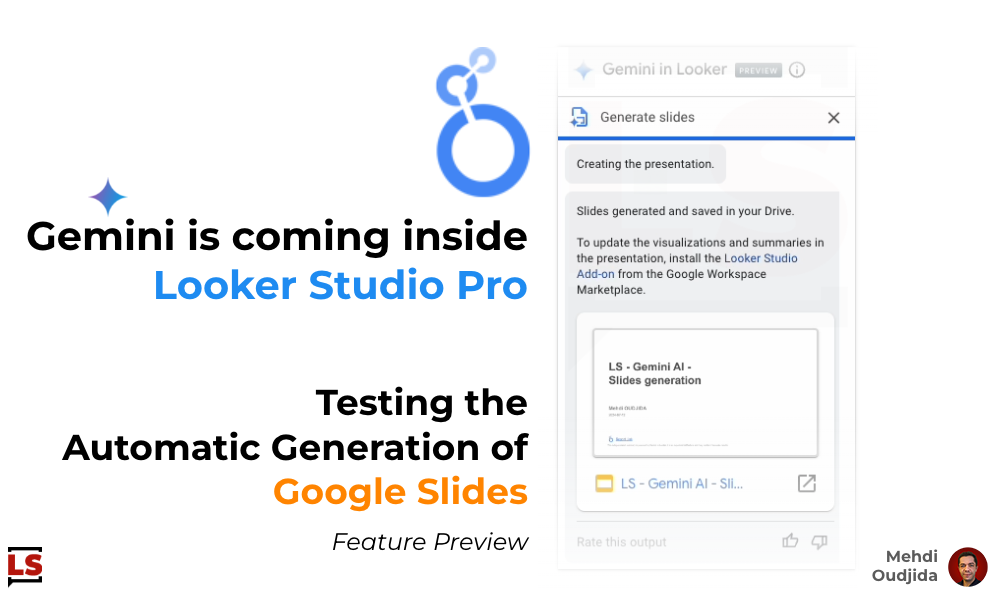
Yesterday, we saw with a real life use case how the Formula Assistant will help us to build calculated fields
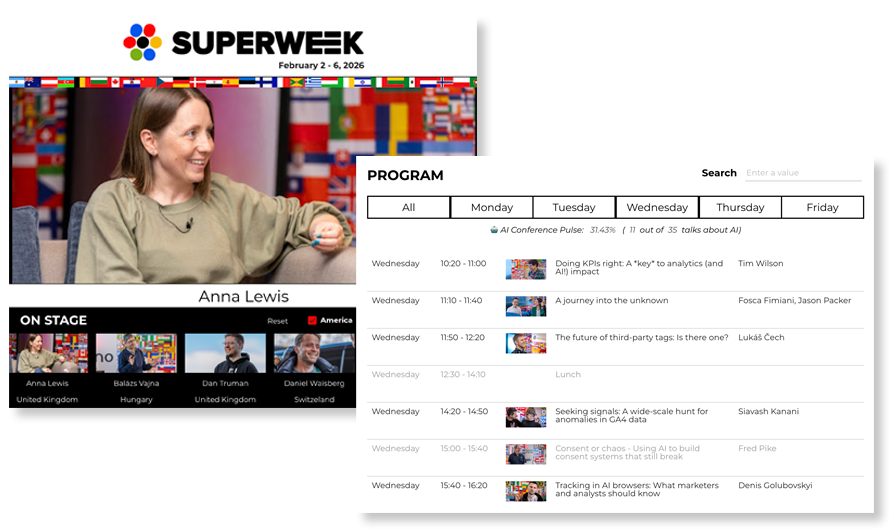
2026 Edition As I do every year ahead of Superweek Analytics Summit, I rolled out a new version of my
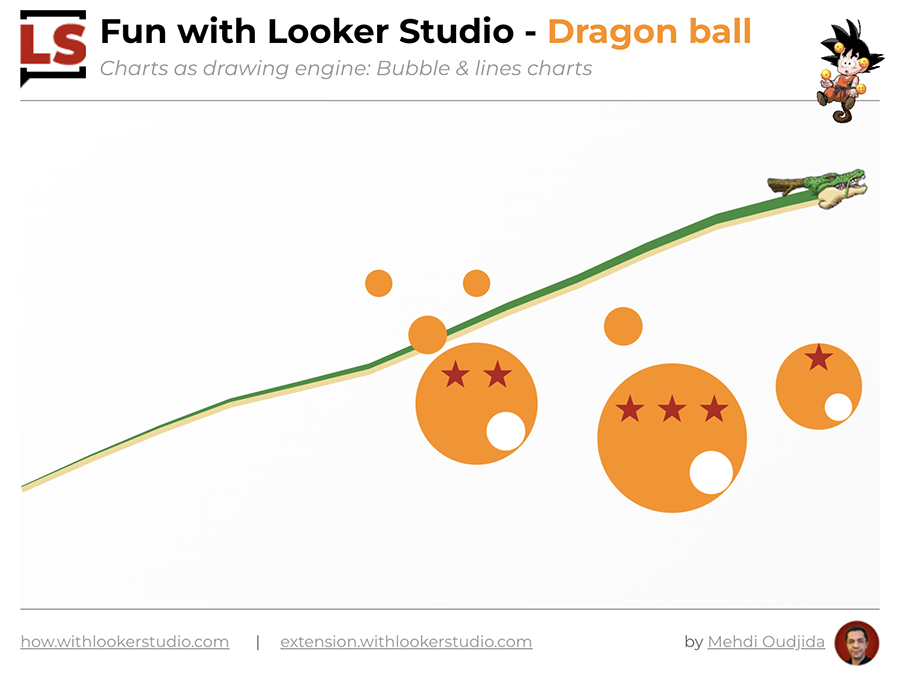
Le’s have fun with Looker Studio, using Using charts as a drawing engine! Dragon Ball was a cartoon of my
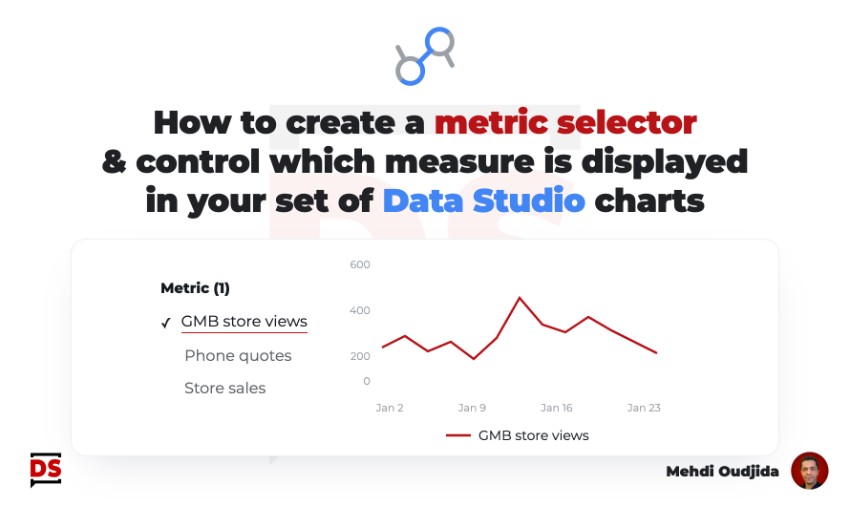
Let’s go back to the basic to create a simple metric selector. This allows to change the measure displayed inside
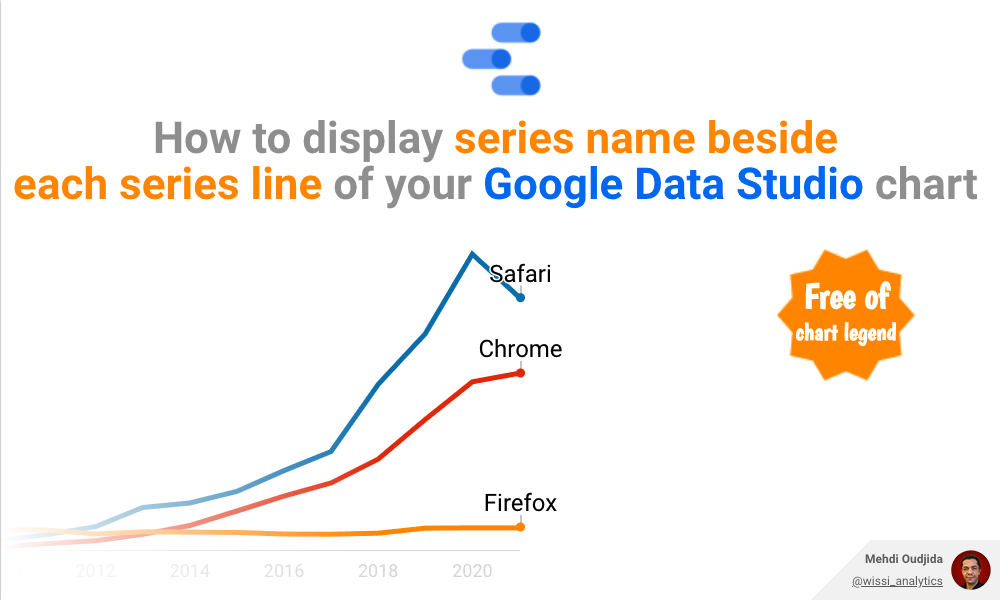
For a lot of cases, legends are not the best visualization solution for line chart (and similar trends chart types).
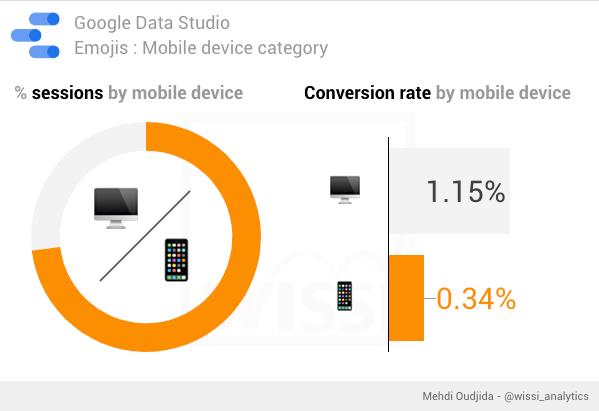
Your situation 💡 Fast and easy solution : EMOJI! 🤗 Emojis compatibilities and access Emojis are system-managed special characters. it