
Data Studio Vs Looker Studio with Google Trends data
Looker Studio becomes Data Studio…again Shortly after the announcement of Looker Studio being renamed back to Data Studio, I thought
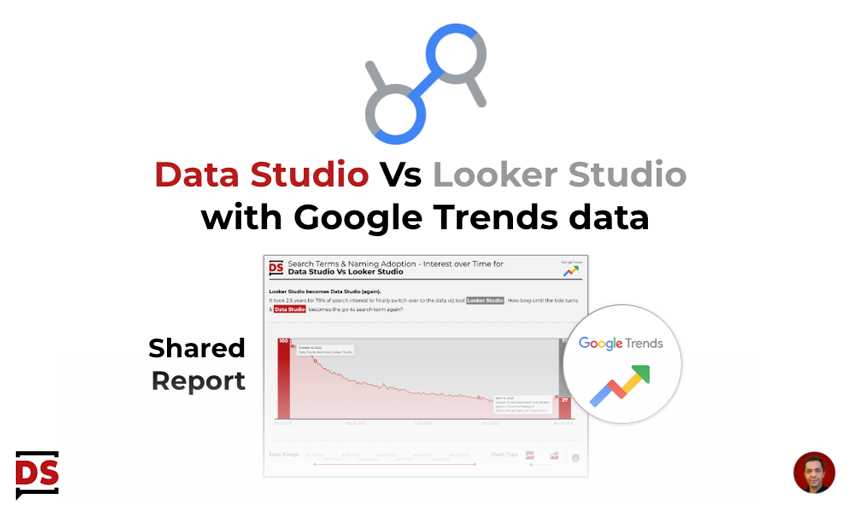
Looker Studio becomes Data Studio…again Shortly after the announcement of Looker Studio being renamed back to Data Studio, I thought
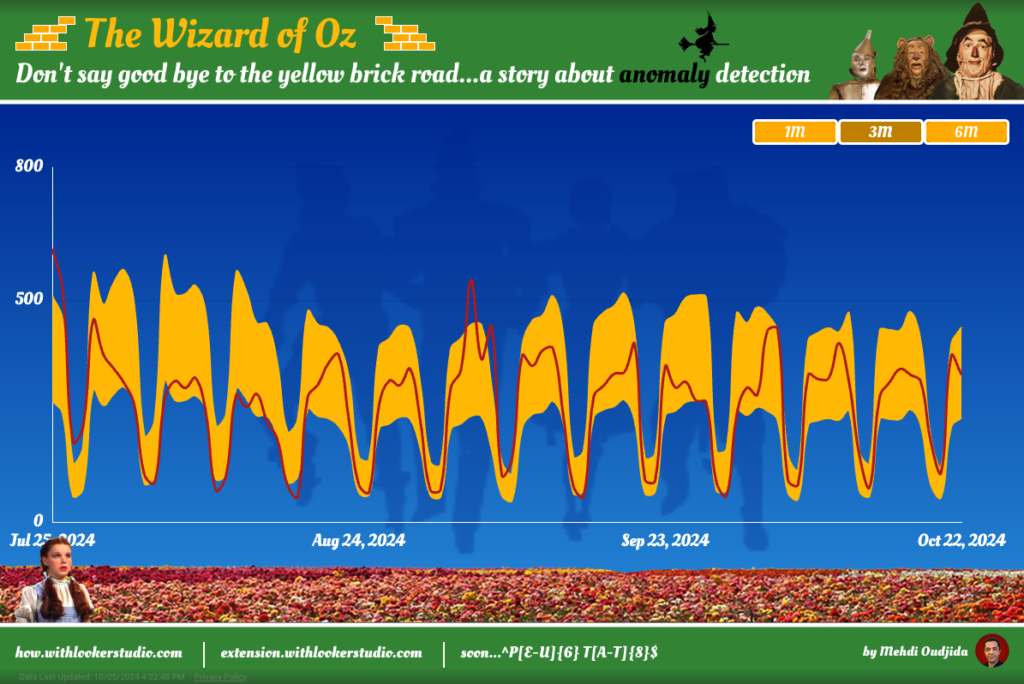
The story begins with the need to graphically represent metric variations and the related expected range values in Looker Studio.
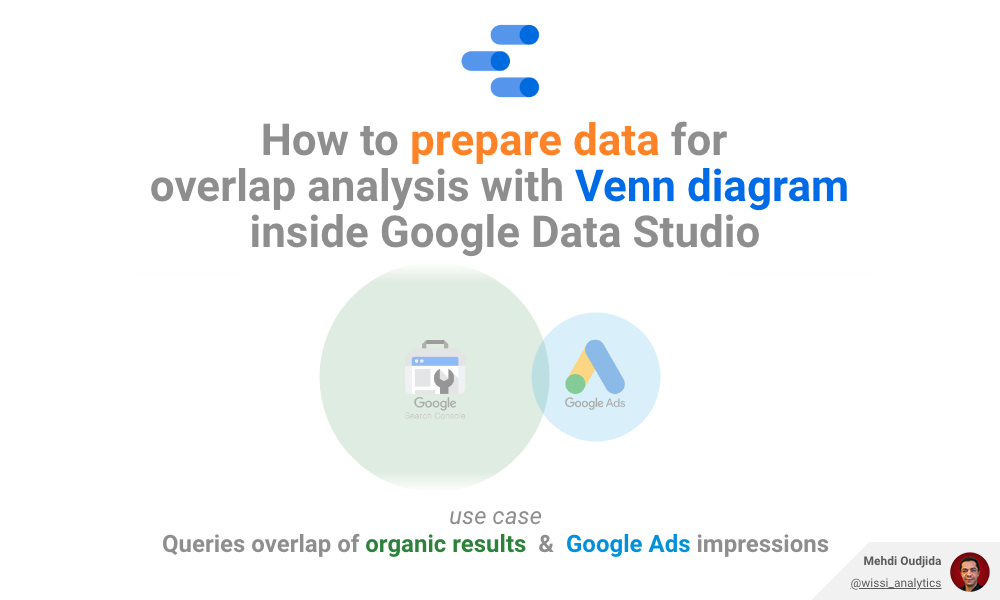
I always prefer preparing data outside Data Studio and I always prefer using builtin chart types when it is possible.