
Insight video clips with Gemini 3 for your standalone data story telling
A few months ago I created a just-for-fun report that displays product ranking data and track the associated volatility. At
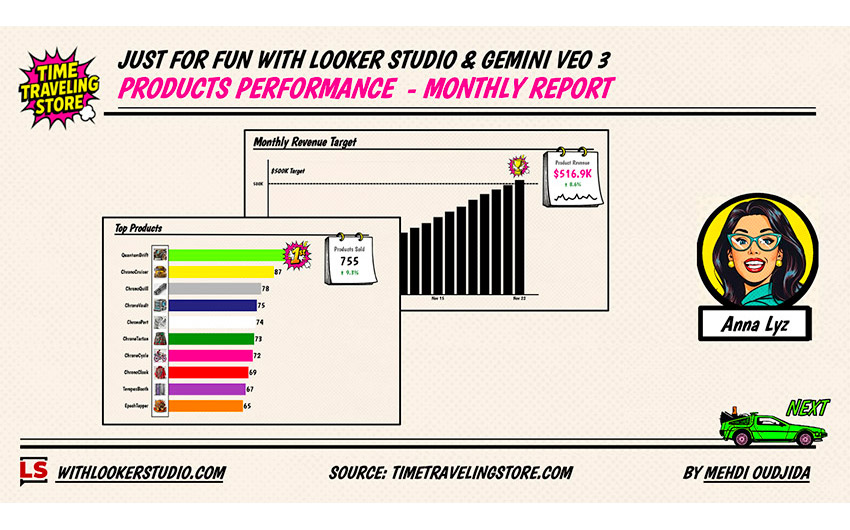
A few months ago I created a just-for-fun report that displays product ranking data and track the associated volatility. At
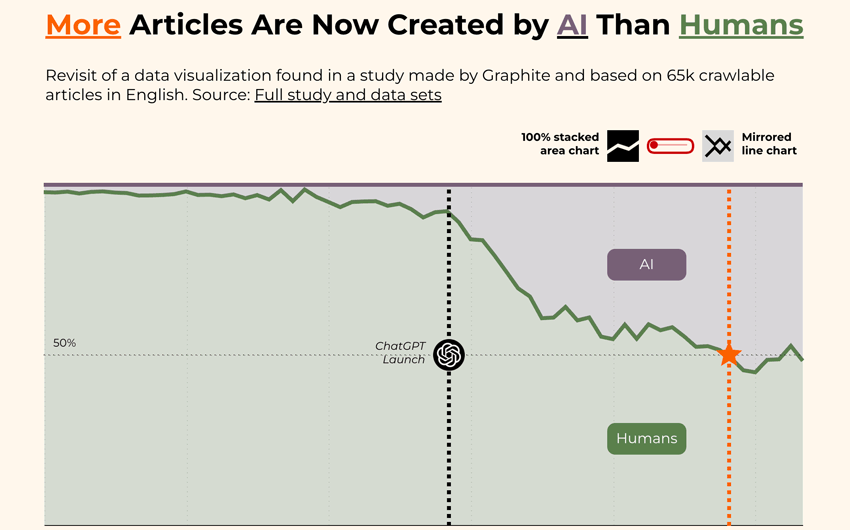
I’m not a big fan of mirrored line charts and that’s putting it mildly. Mirrored Line Charts I completely understand
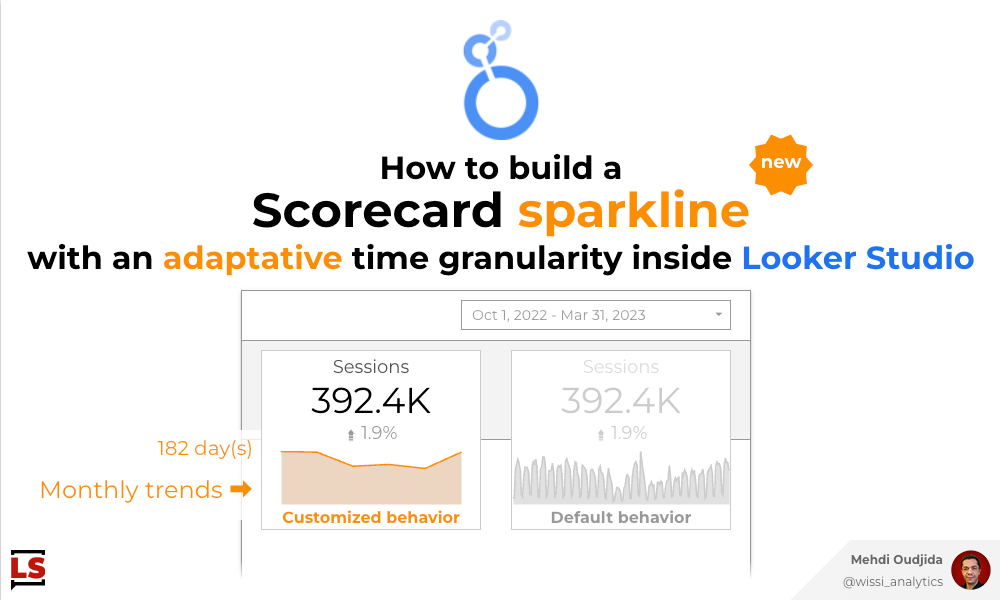
Sparkline is a mini line chart without axis and labels to get more context about the trend of a displayed
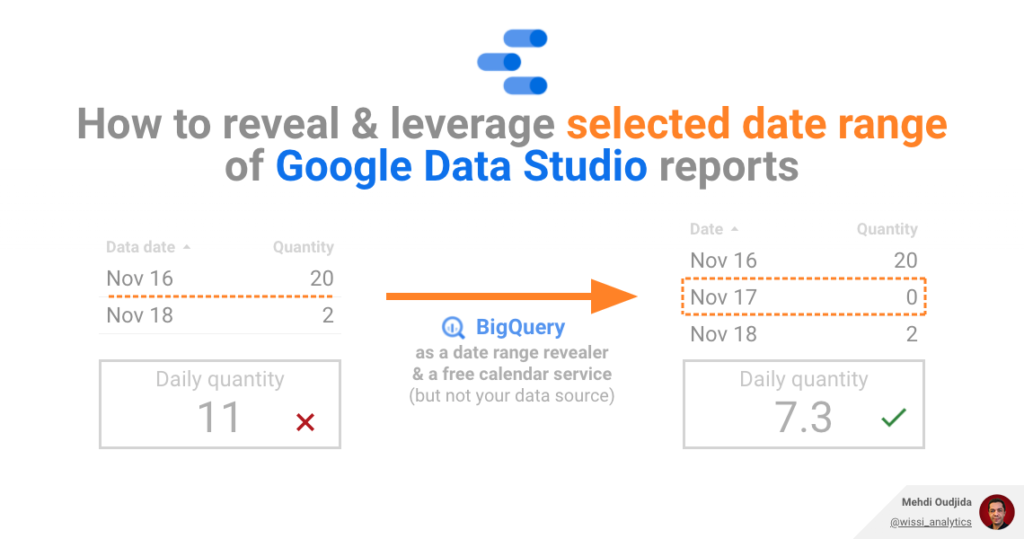
Need to access to selected date range and related time repository Most of data sources and related APIs provide rows
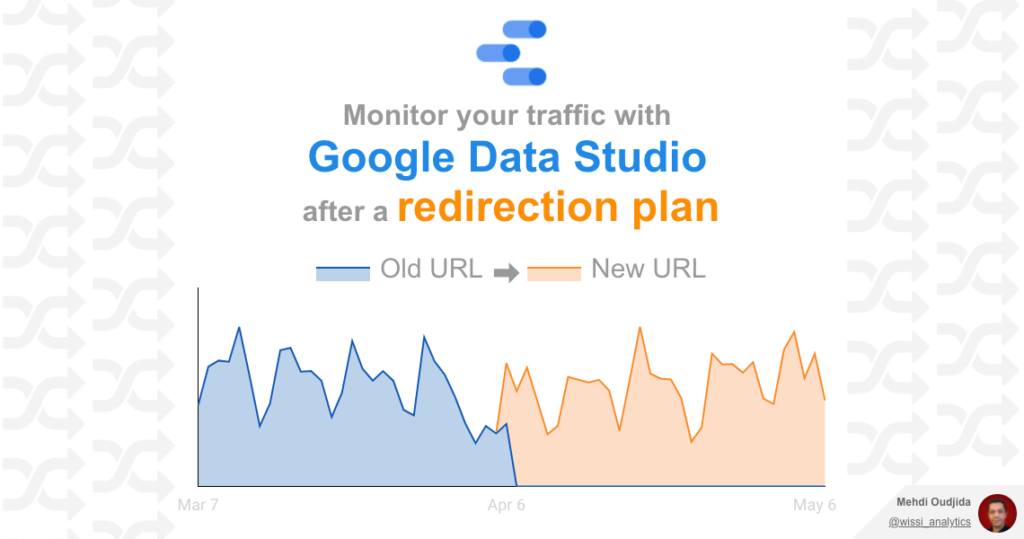
The preparation & the deployment of a URLs redirection plan require method, know-how, a lot of rigor of execution, involving
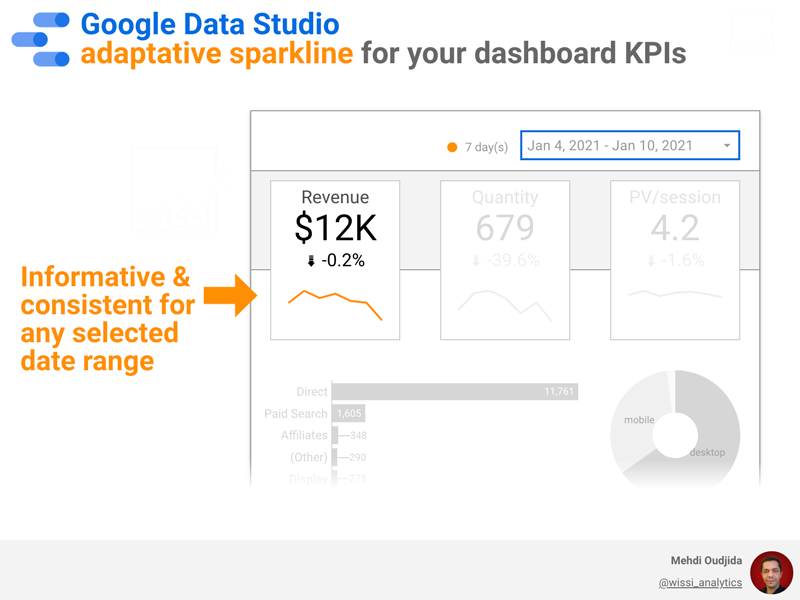
Dashboard KPIs are often enhanced with time comparison (with the previous period or the previous year) as a small score