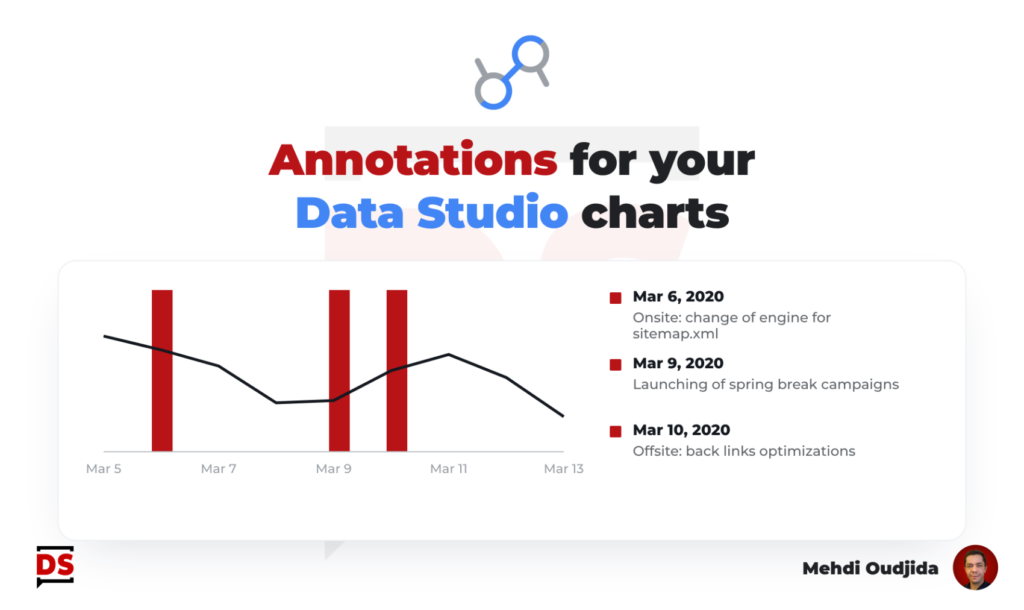
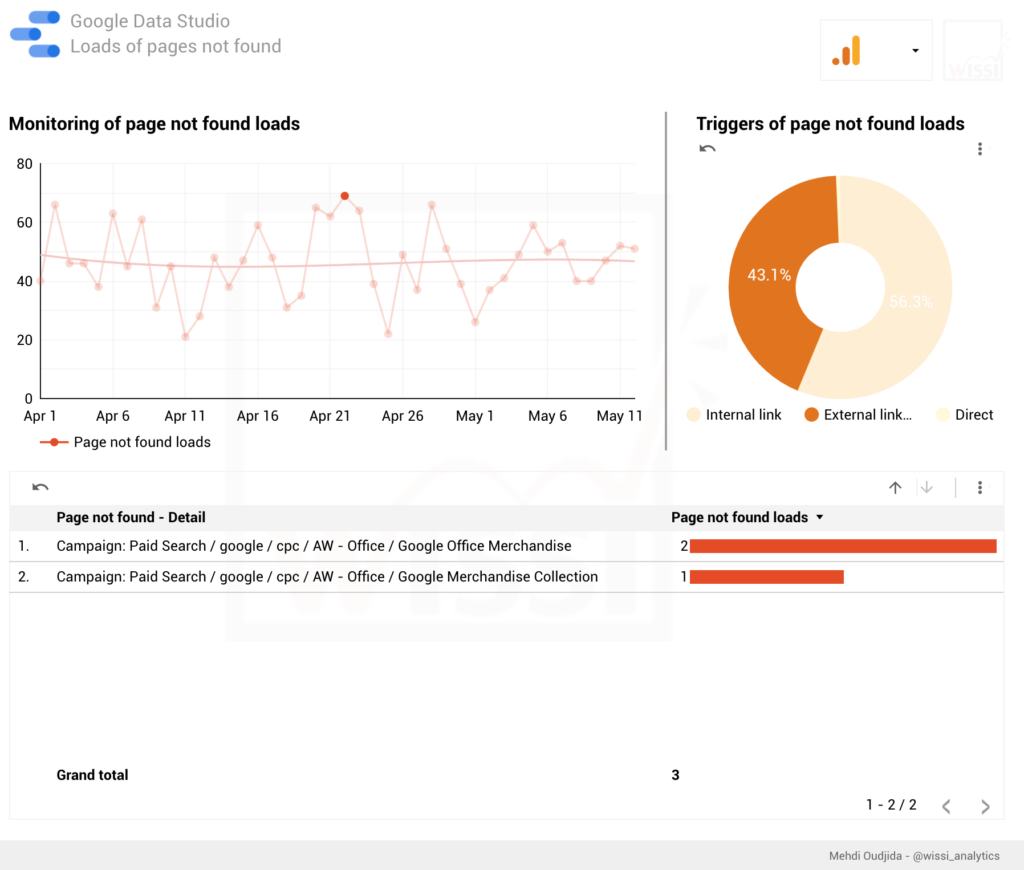
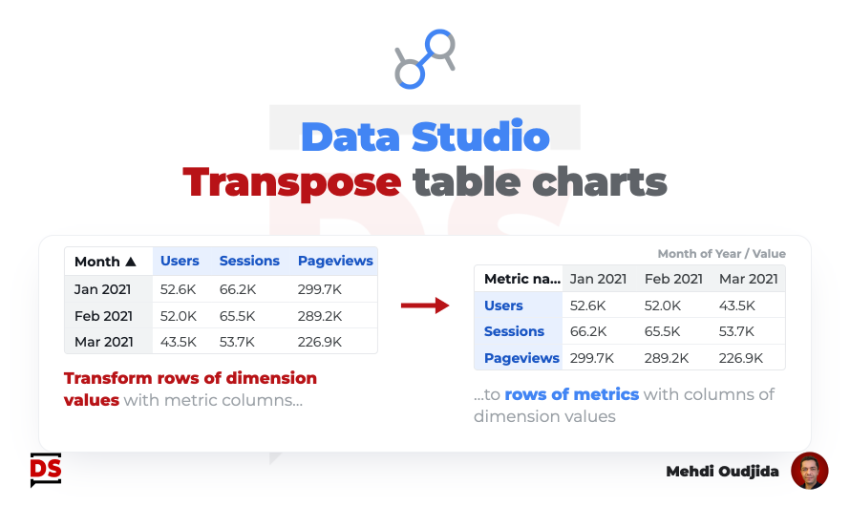
Conditional formatting is typically a very good automatic highlight system for dashboards to read fast and see what it is the more important.
On the other hand, Google Data Studio can be also used for manual reports and data viz for analysis exposure, (and why not during a presentation meeting) requiring to highlight manually but dynamically a part of chart based on dimension and comment it.
So, for that kind of cases, let’s build this simple system I called “chart highlighter”.
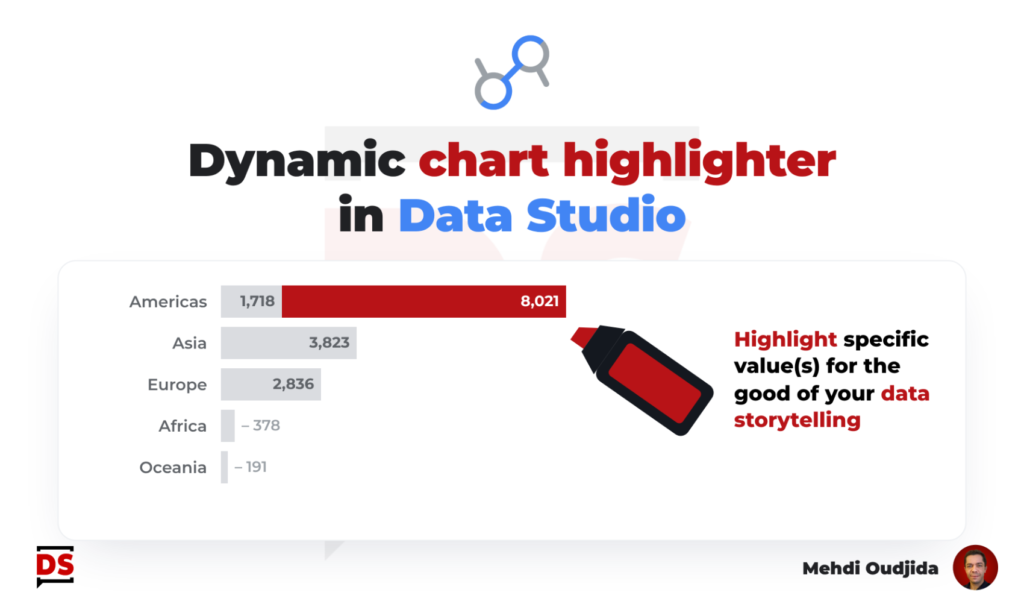
Getting the capability to highlight manually a part of a chart means also getting the opportunity to afford the luxury to design in a neutral way what should be more in the background of the data story.
So, let’s take this opportunity to apply a best practice of story telling and data visualisation : “one by one message, one by one thing, one by one highlight”…
…Highlighting everything is equivalent to highlighting nothing…yes, it is obvious but to apply it, we need to built required means inside our data viz tool.
Unlock free access to the full article
Access to this article written by Mehdi Oudjida, Data Studio Expert, is completely free: enter your email address to receive an access link to the full article.
Your email address is only used to send the link, and for the newsletter if you tick the box. It is not stored on this site.