
Data Studio Vs Looker Studio with Google Trends data
Looker Studio becomes Data Studio…again Shortly after the announcement of Looker Studio being renamed back to Data Studio, I thought
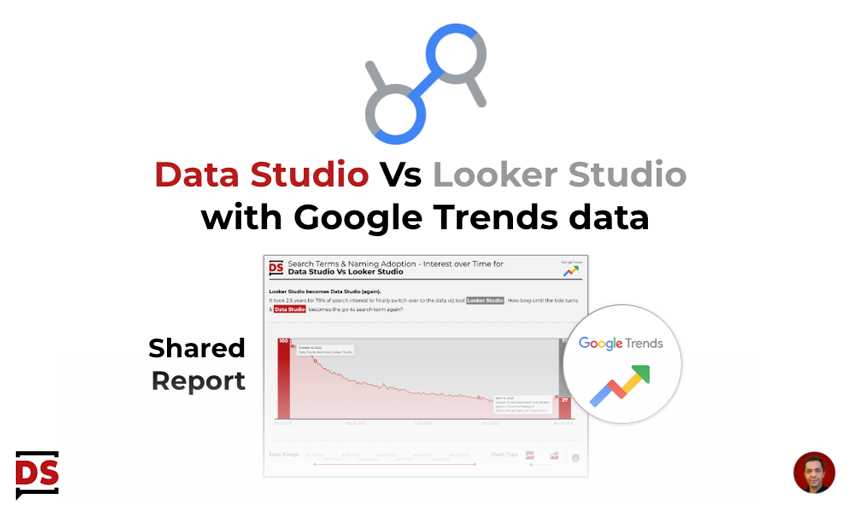
Looker Studio becomes Data Studio…again Shortly after the announcement of Looker Studio being renamed back to Data Studio, I thought
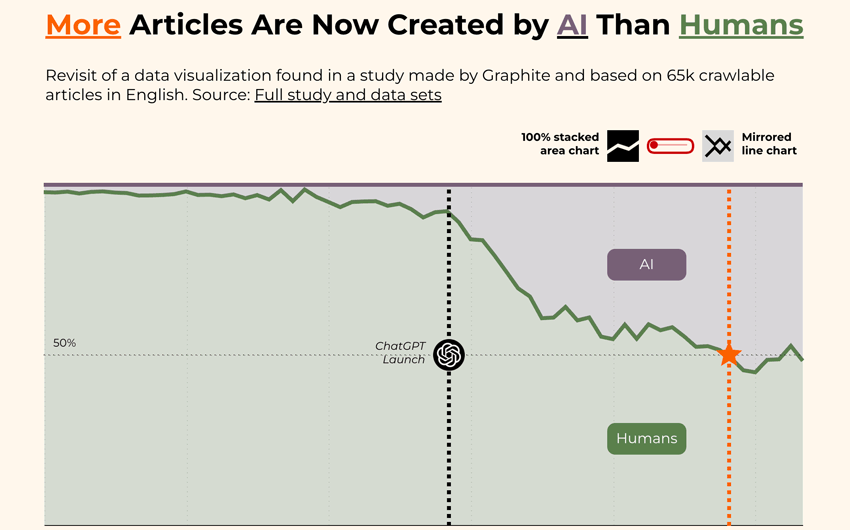
I’m not a big fan of mirrored line charts and that’s putting it mildly. Mirrored Line Charts I completely understand
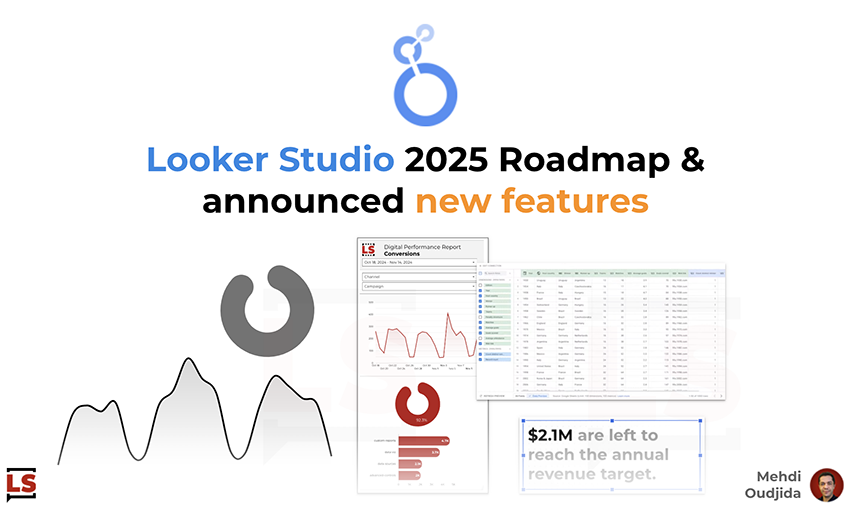
Few days ago, the Google Cloud BI team introduced the roadmap of Looker & Data Studio (ex Looker Studio) products.
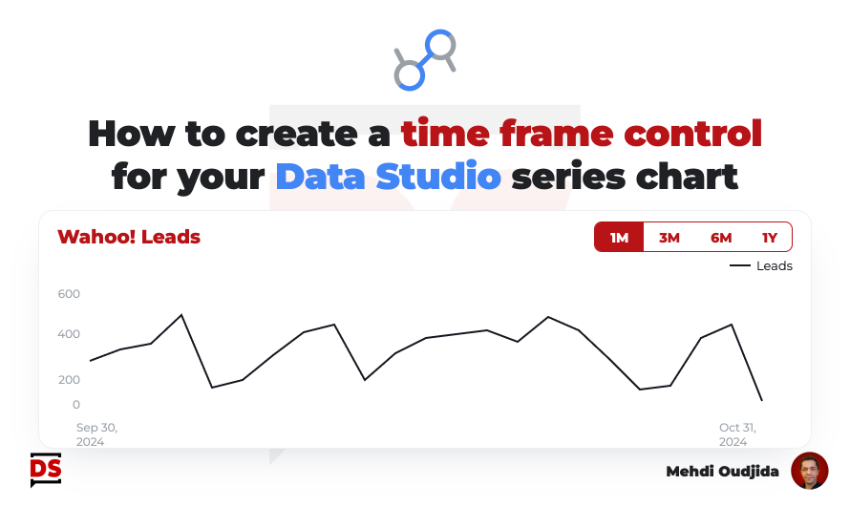
This tutorial describing how to create a time frame control has been inspired by a question from the community. This
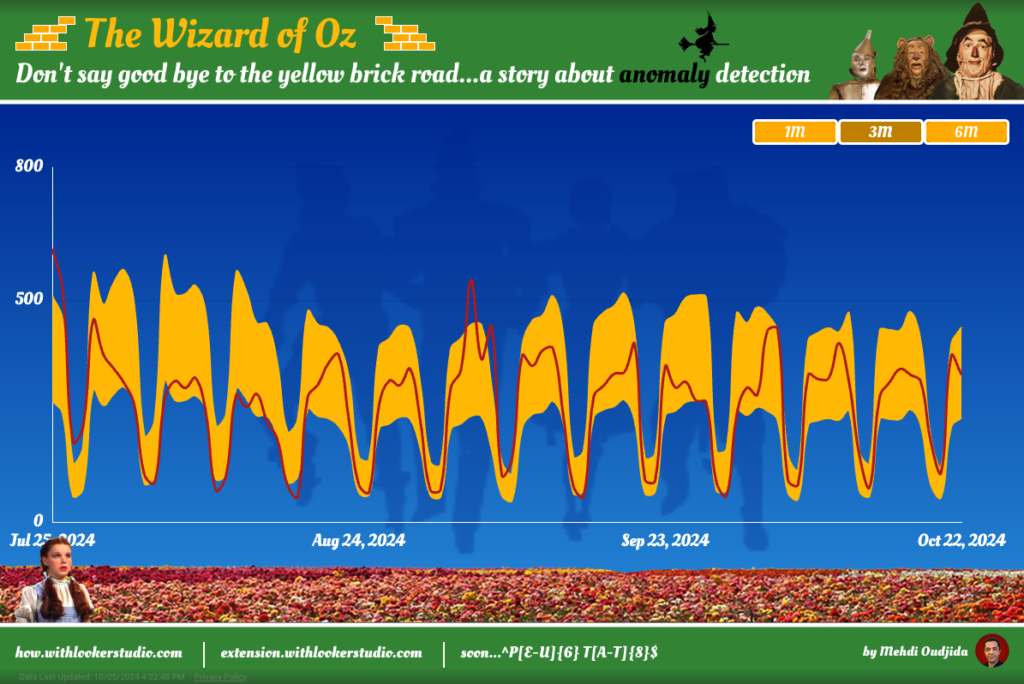
The story begins with the need to graphically represent metric variations and the related expected range values in Looker Studio.
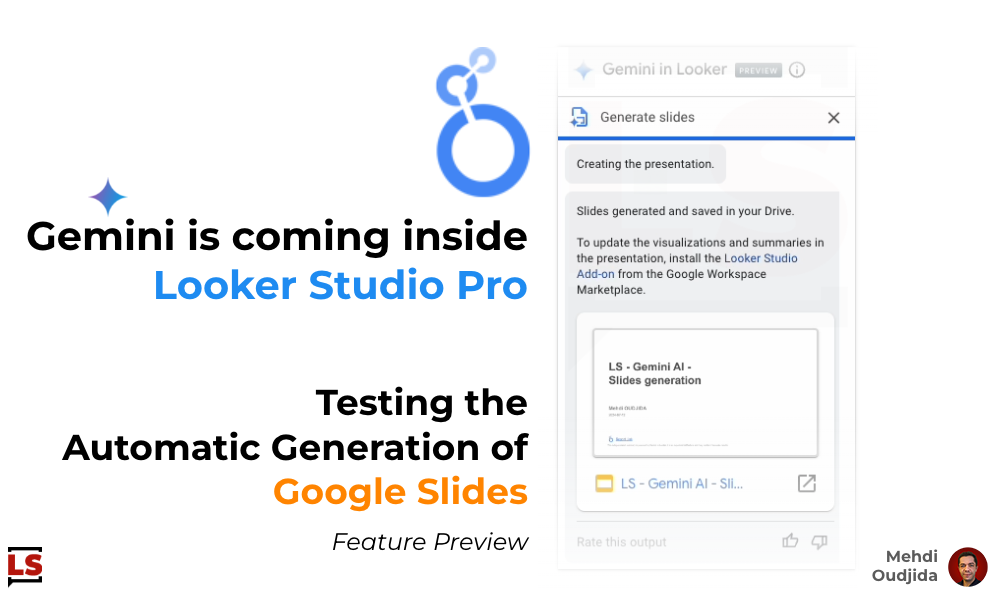
Yesterday, we saw with a real life use case how the Formula Assistant will help us to build calculated fields
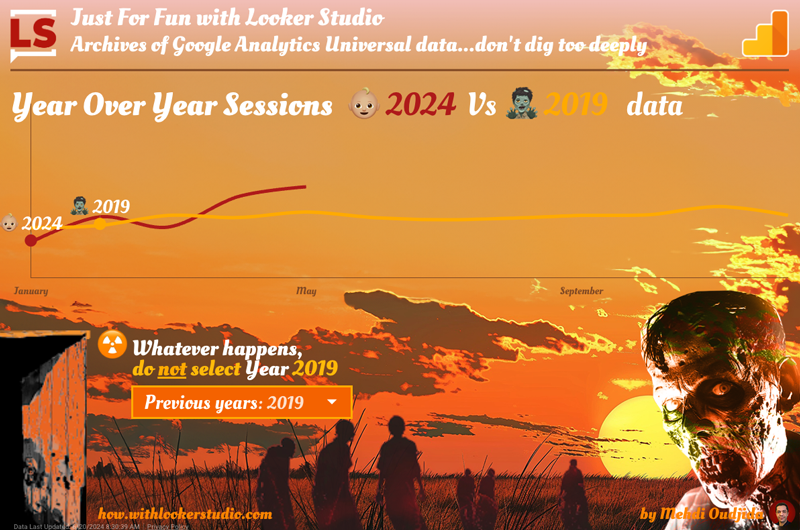
As any Google Analytics practitioner, you made some archives of GA Universal data and are ready for the full sunset
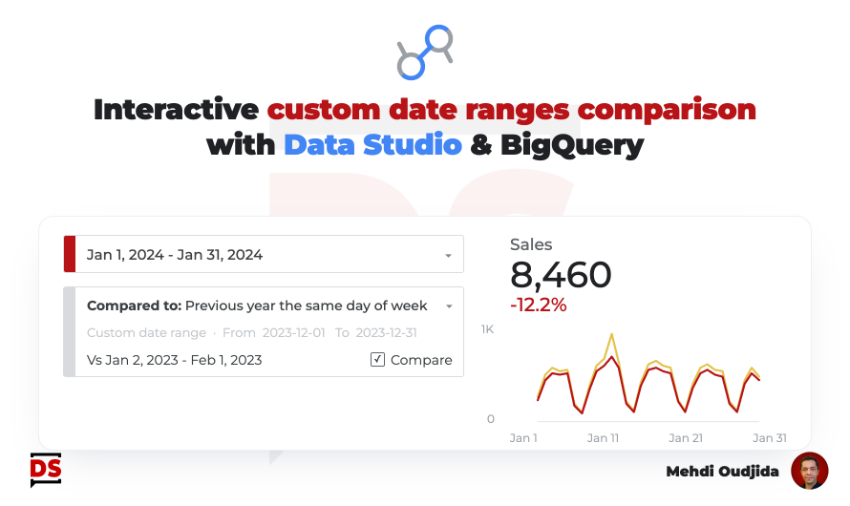
Two years ago, I started working on this interactive comparison date range solution within Data Studio, to fill a gap
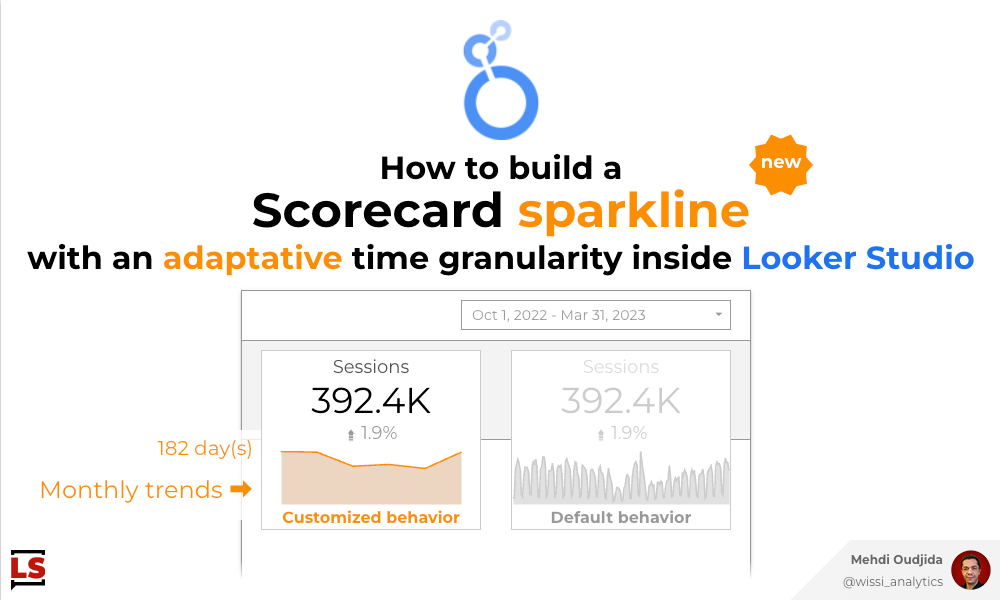
Sparkline is a mini line chart without axis and labels to get more context about the trend of a displayed
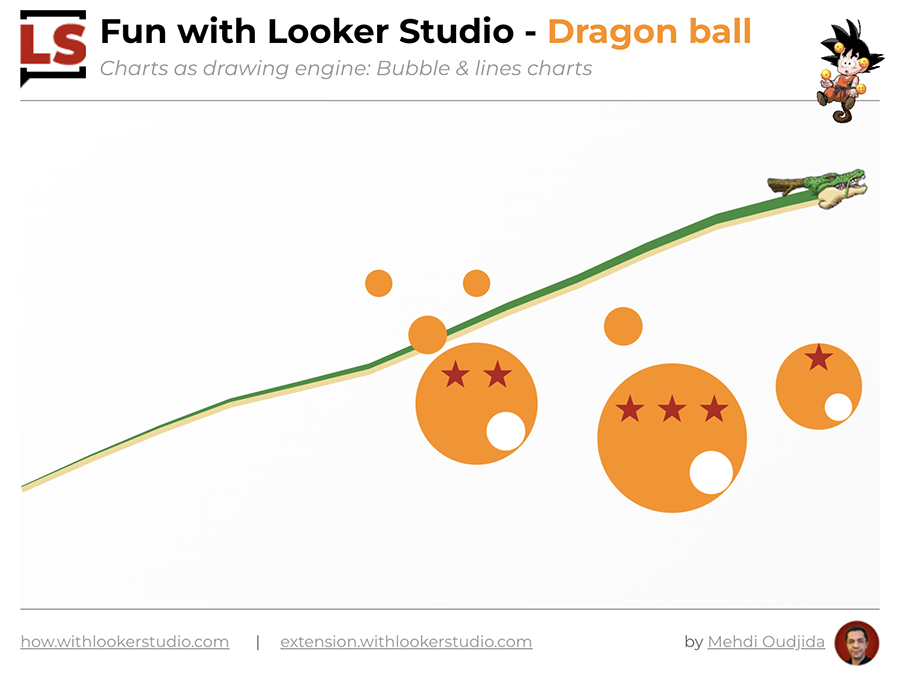
Le’s have fun with Looker Studio, using Using charts as a drawing engine! Dragon Ball was a cartoon of my