
How to insert a glossary in your Data Studio report
“What does this metric mean exactly?” If you build reports for other people, you have heard this question many times.
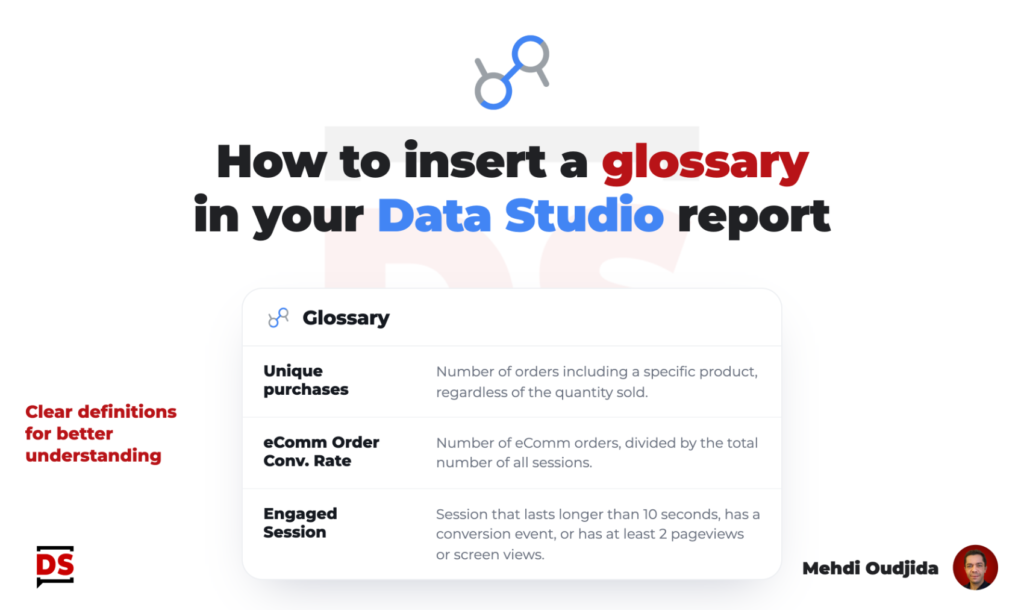
“What does this metric mean exactly?” If you build reports for other people, you have heard this question many times.
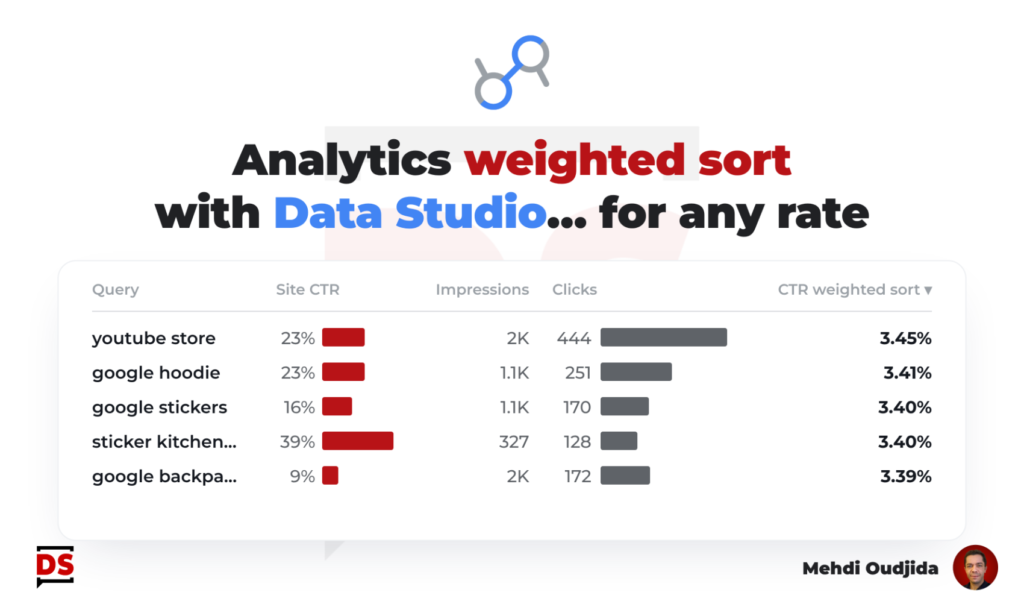
Weighted sort was a nice feature from Google Universal Analytics table charts. Adjusting the sorting to inject the importance of
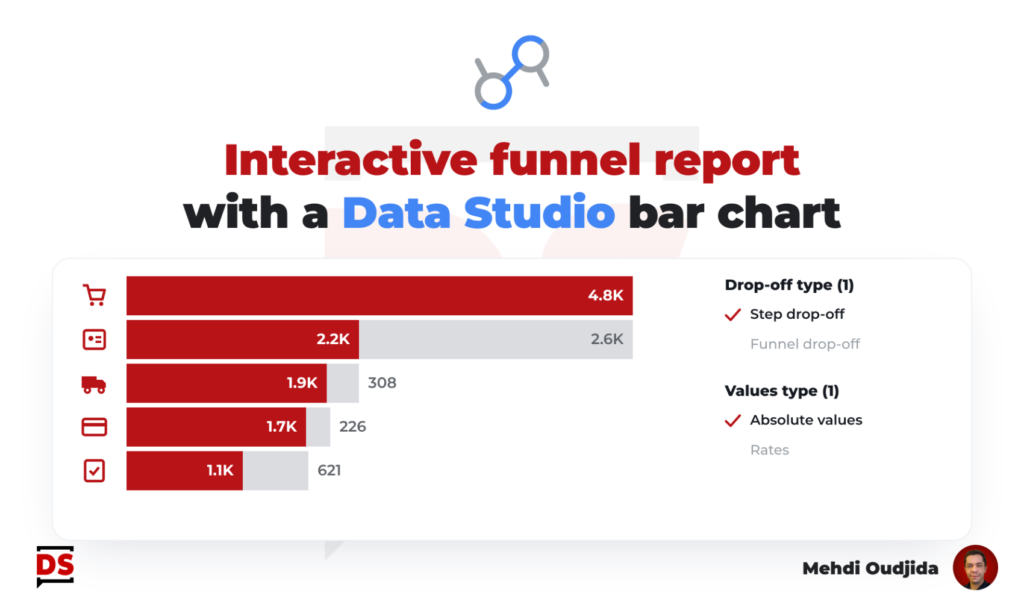
Last year, I wrote an article describing how to build a simple funnel chart with a single table chart. A
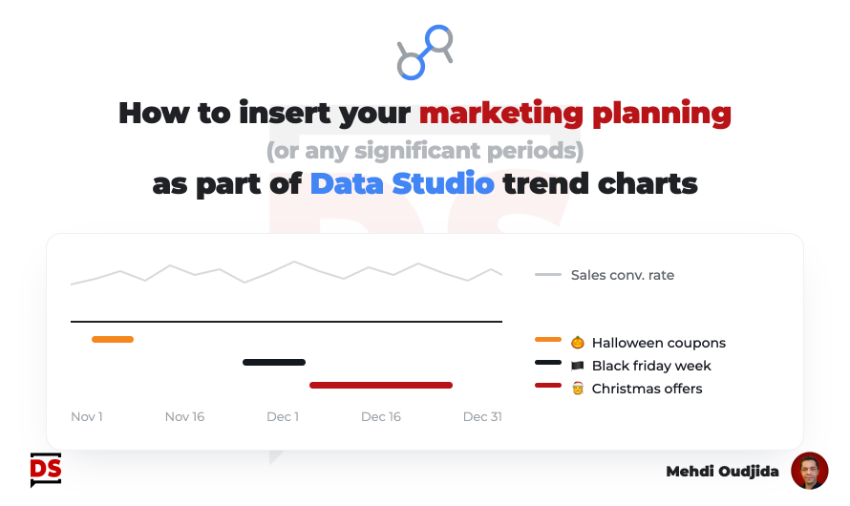
Few years ago, I wrote a tutorial about how we can include annotations inside Data Studio line charts. My custom
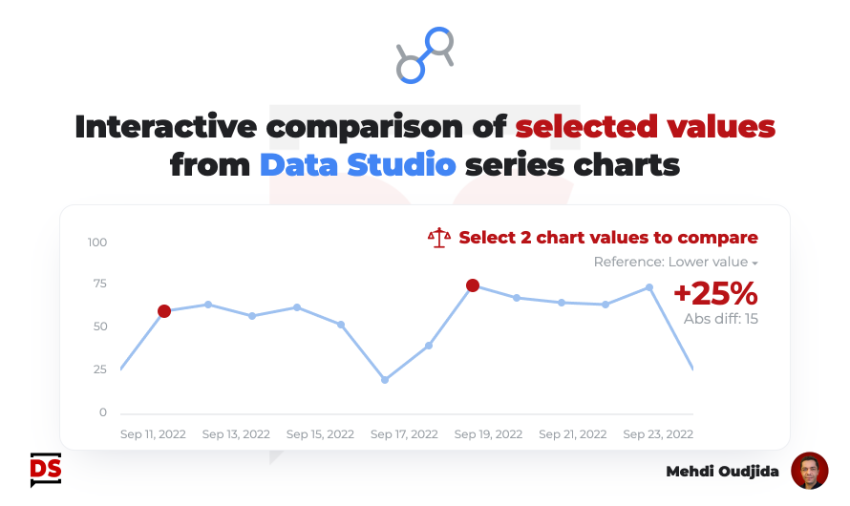
Keeping charts as simple as possible is very challenging. For some cases, a single interactive feature can offer a first
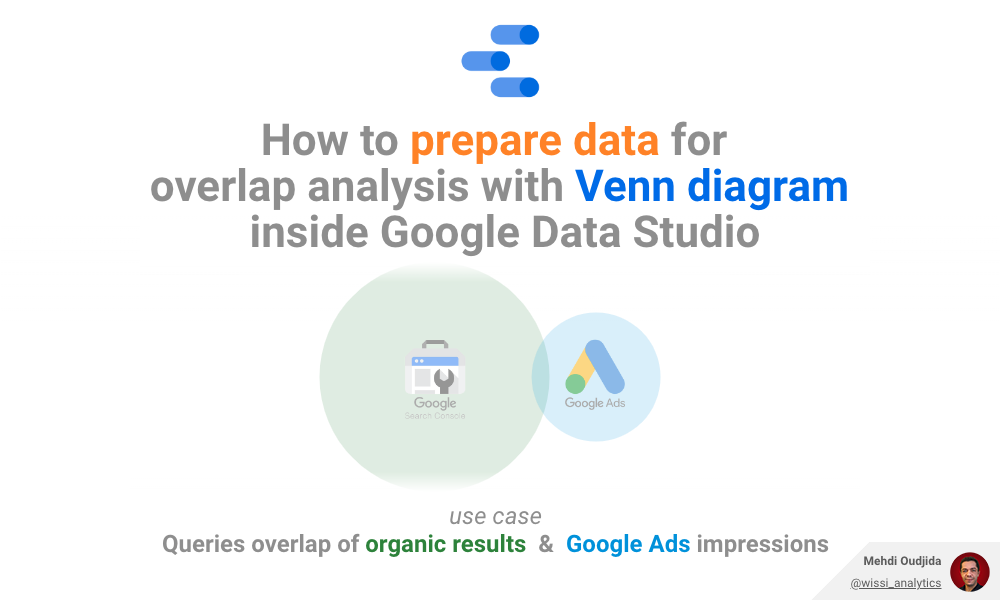
I always prefer preparing data outside Data Studio and I always prefer using builtin chart types when it is possible.
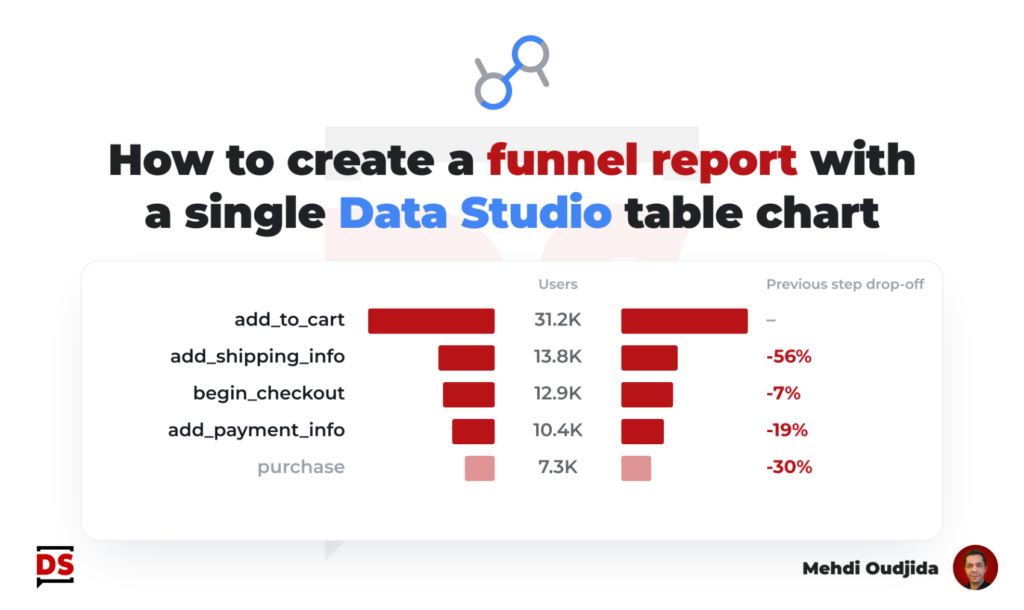
Funnel report type inside Data Studio, a recurring need for a popular visualization. There are a lot of solutions, templates,
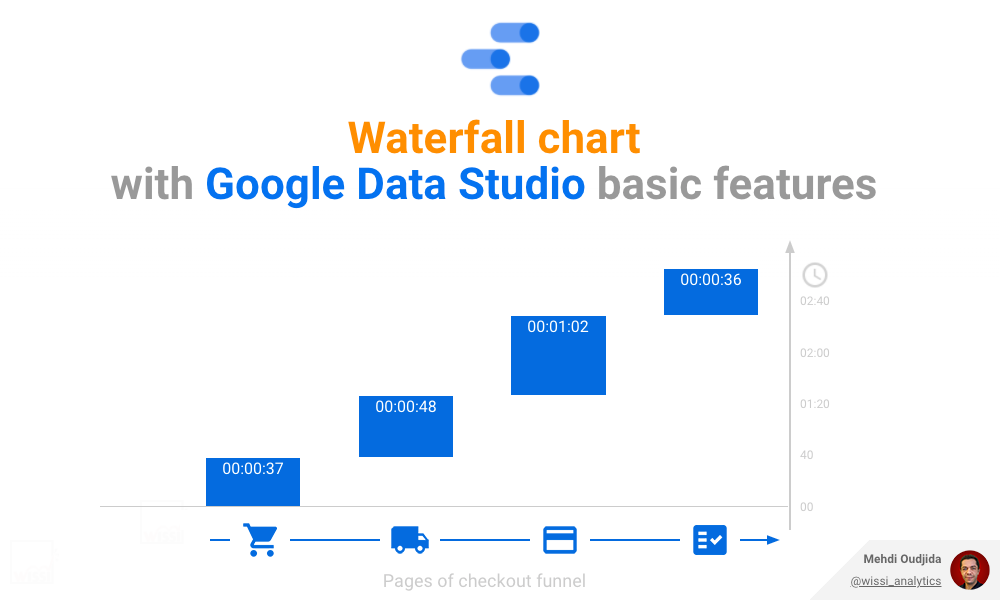
Waterfall charts are nice & efficient to visualize cumulative values of a metric and the related participation weight of each
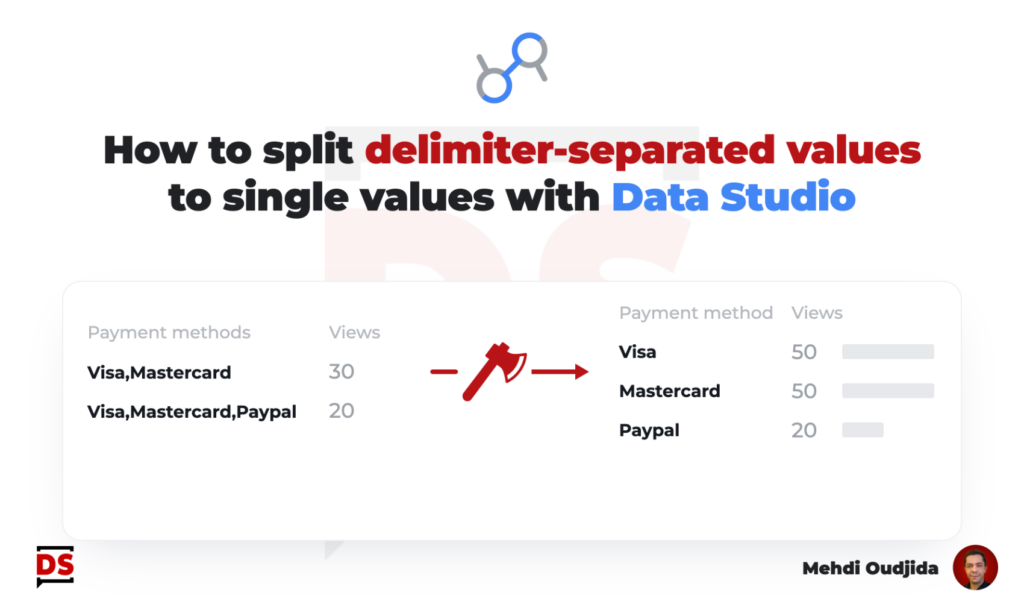
Let’s describe step by step, inside Data Studio (formerly known as Google Data Studio) – how to split delimiter-separated values
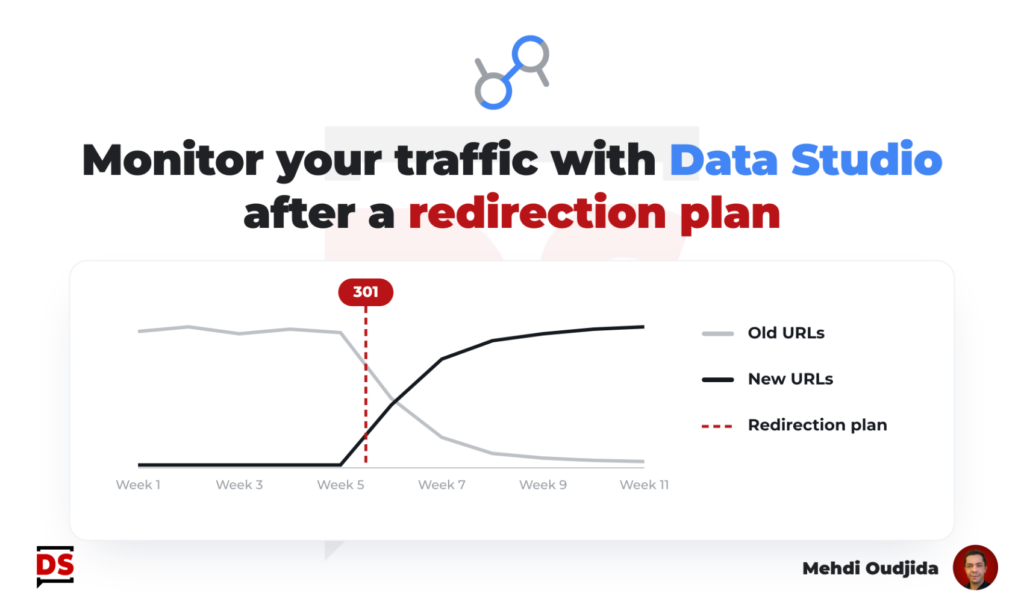
The preparation & the deployment of a URLs redirection plan require method, know-how, a lot of rigor of execution, involving