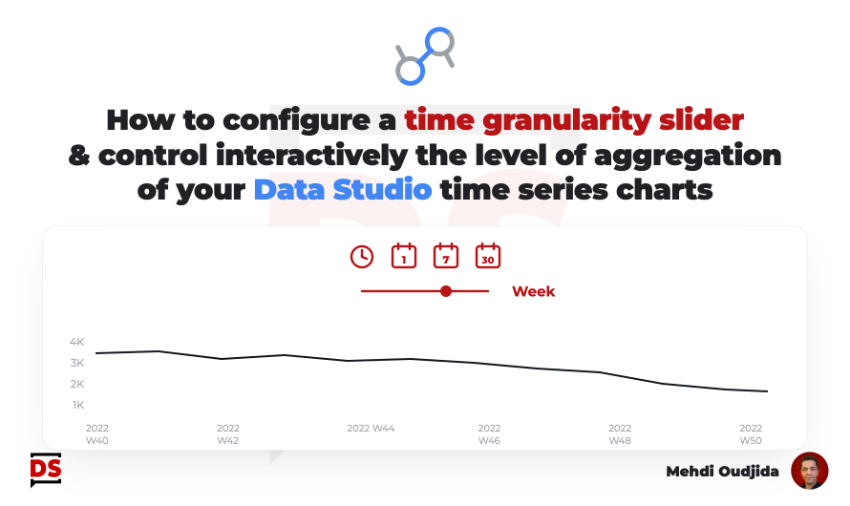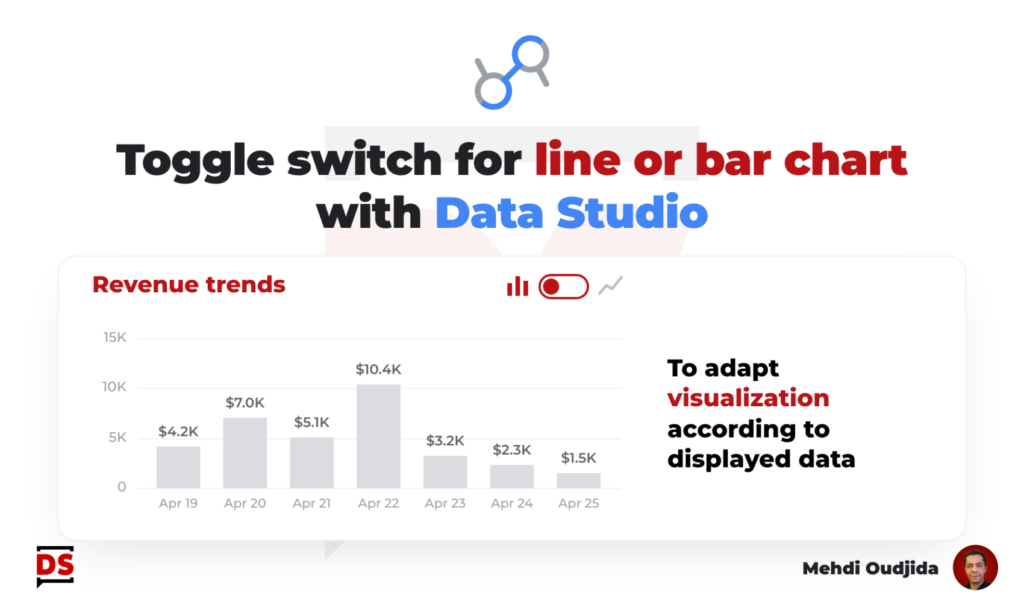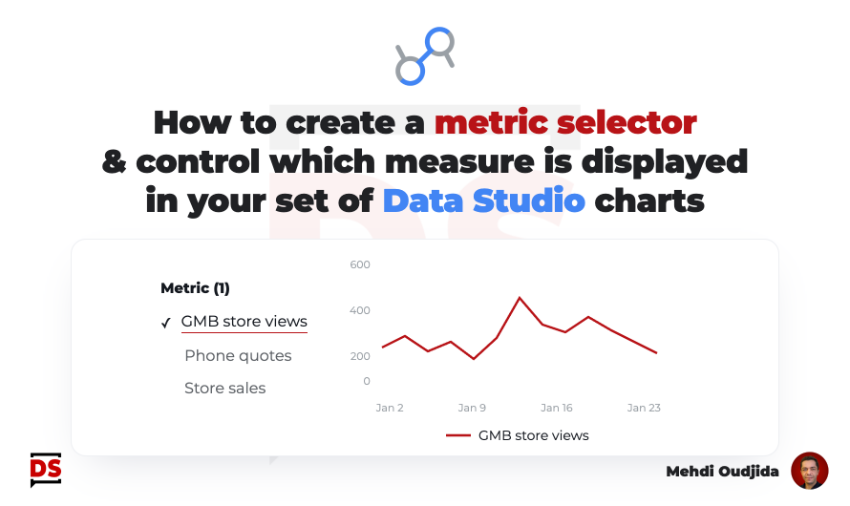
Let’s go back to the basic to create a simple metric selector. This allows to change the measure displayed inside a set of Data Studio charts (formerly known as Looker Studio) as report reader.
Taking of avantage of a simple configuration, this kind of control gets a lot of benefits and can be implemented for various reasons:
- Displaying the main metric is your concern but the same charts can be useful for secondary measures (basically, optional metrics, shared across more than one chart)
- You don’t want to overload your report with chart sets, replicated for each metric
- Your chart configuration is quite sophisticated and parameter variables are enough to not repeated elements, easier to maintain in the future
- You need to reduce the number of data requests, and so, what is not loaded when the page is displayed is also what will not affect costs or quotas, measure requests just on demand
- It is more an exploration tool. You know how to display data but not what
- …
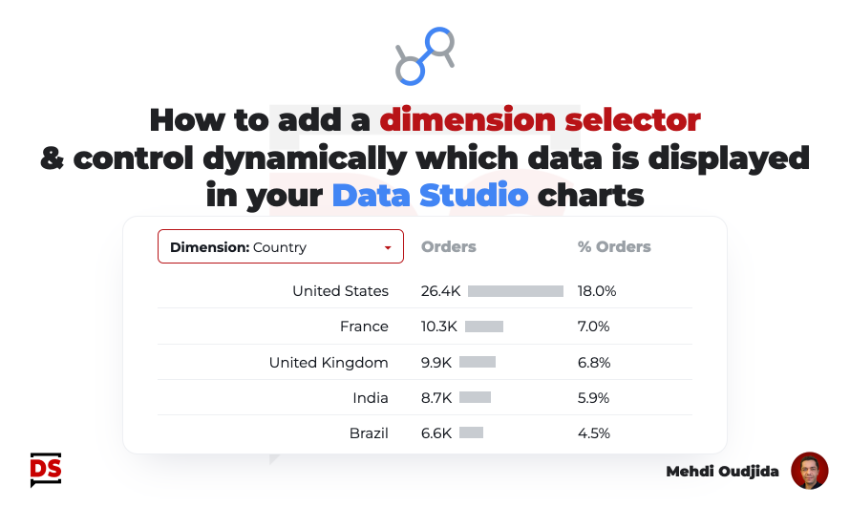
The same principle is also possible with a dimension selector. The related article needs to be updated for minor changes (no more parameter value wrapper to use it as part of a calculated field) but the main part is still relevant.
Unlock free access to the full article
Access to this article written by Mehdi Oudjida, Data Studio Expert, is completely free: enter your email address to receive an access link to the full article.
Your email address is only used to send the link, and for the newsletter if you tick the box. It is not stored on this site.