
BigQuery Graph Measures in Data Studio: Build a Data Source with Multi-Grain Aggregation
“What’s the average basket on my e-commerce site when there’s a promo item in the cart?” A simple question from
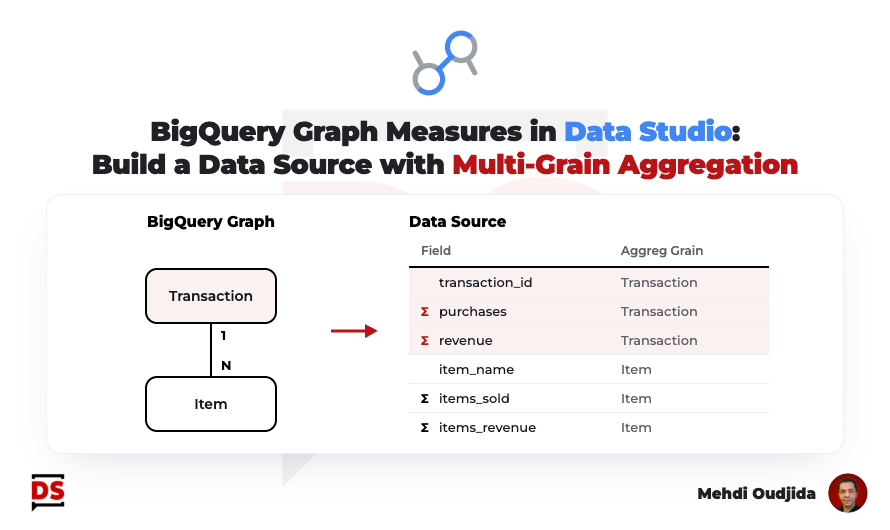
“What’s the average basket on my e-commerce site when there’s a promo item in the cart?” A simple question from
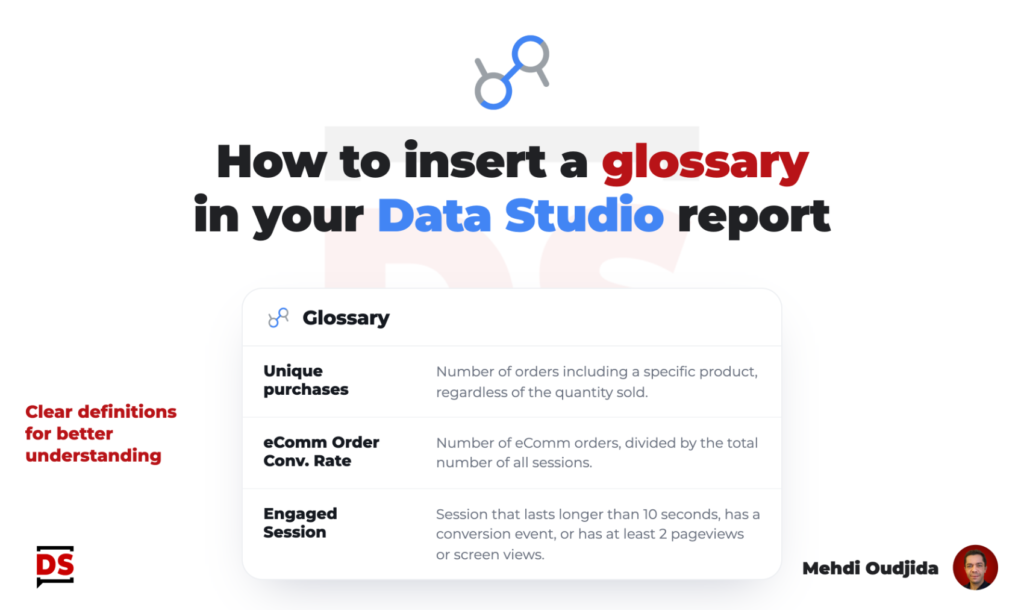
“What does this metric mean exactly?” If you build reports for other people, you have heard this question many times.
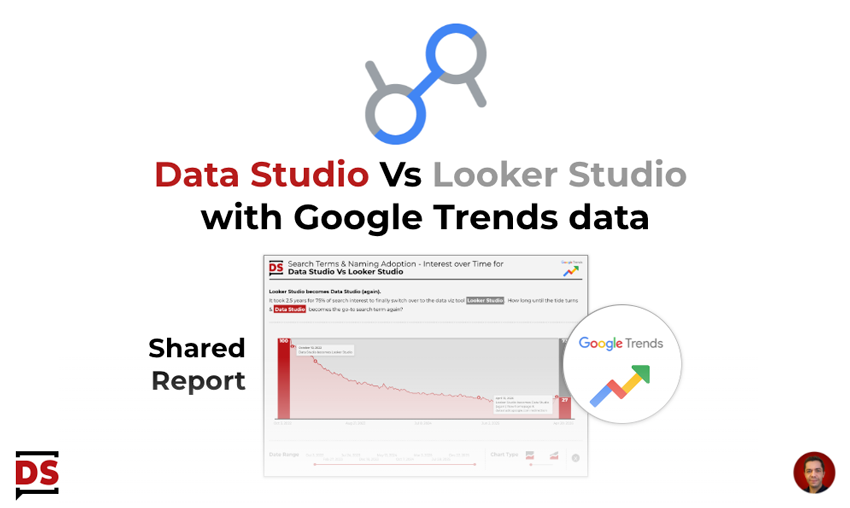
Looker Studio becomes Data Studio…again Shortly after the announcement of Looker Studio being renamed back to Data Studio, I thought
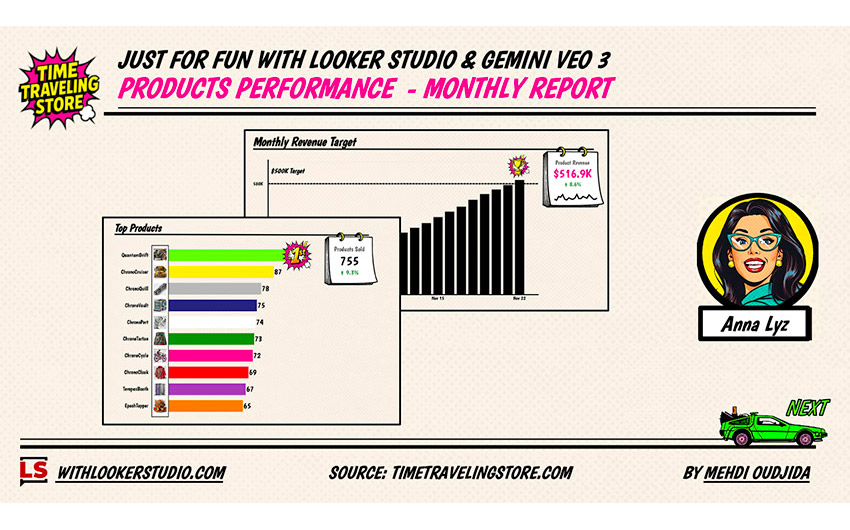
A few months ago I created a just-for-fun report that displays product ranking data and track the associated volatility. At
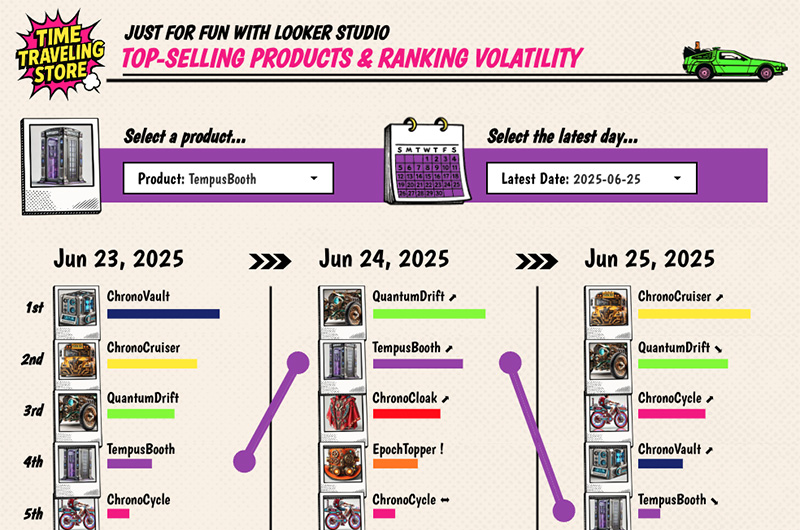
Here comes a new just-for-fun shared report designed with Data Studio. This time, we are going to talk about visualisation
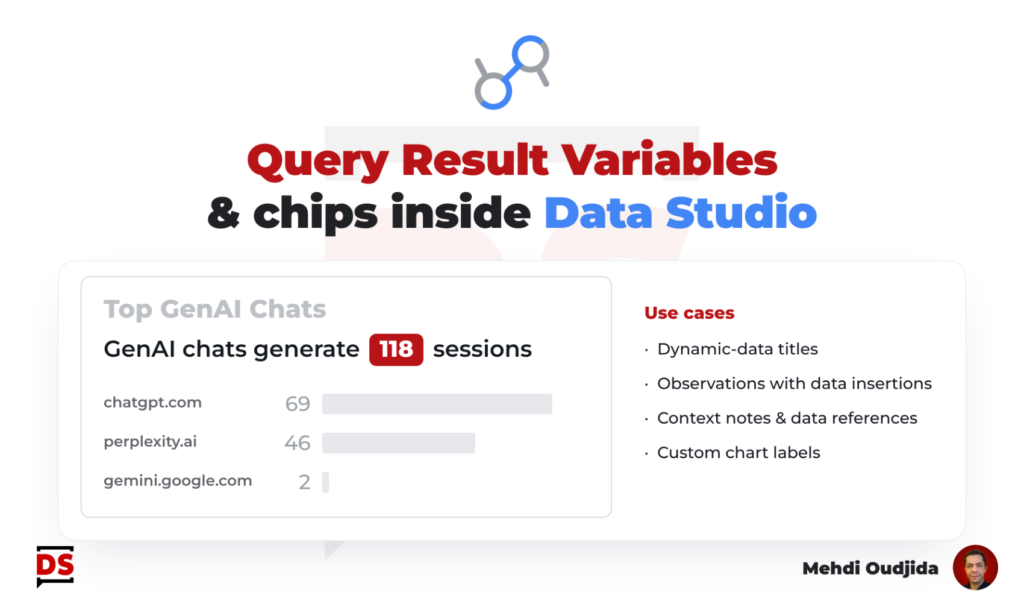
Let’s discover “Query Result Variables” or “Chips” inside Data Studio, a freshly released feature at the same time than 2
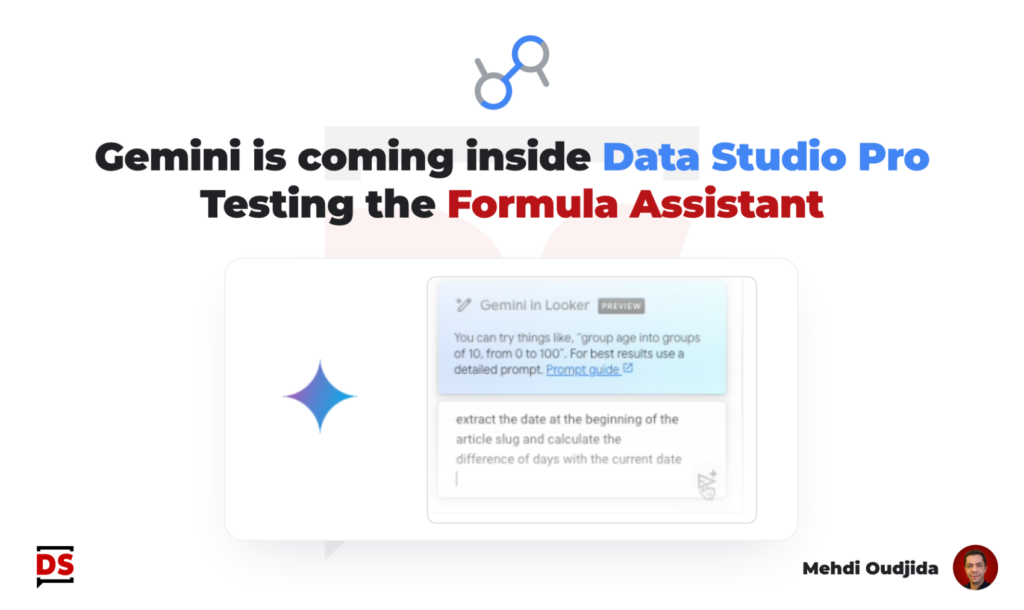
Gemini is coming inside Data Studio Pro and Looker BI. Few months ago, a restricted preview program gave a chance
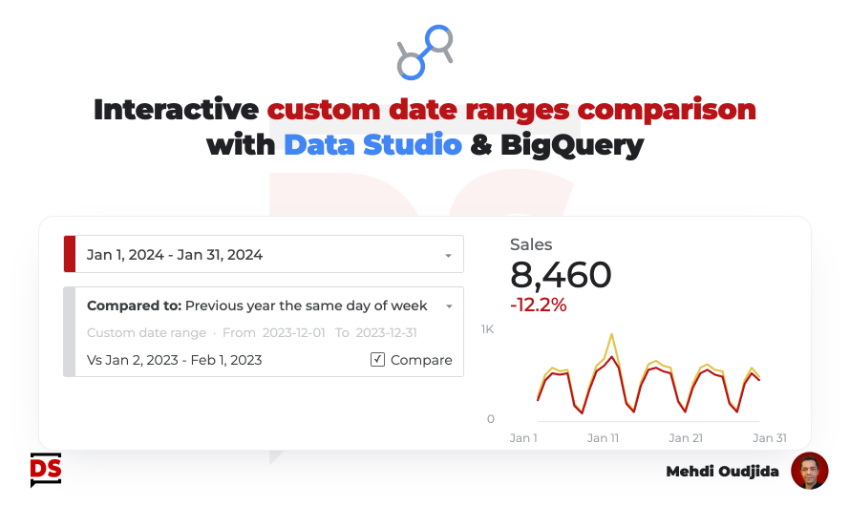
Two years ago, I started working on this interactive comparison date range solution within Data Studio, to fill a gap
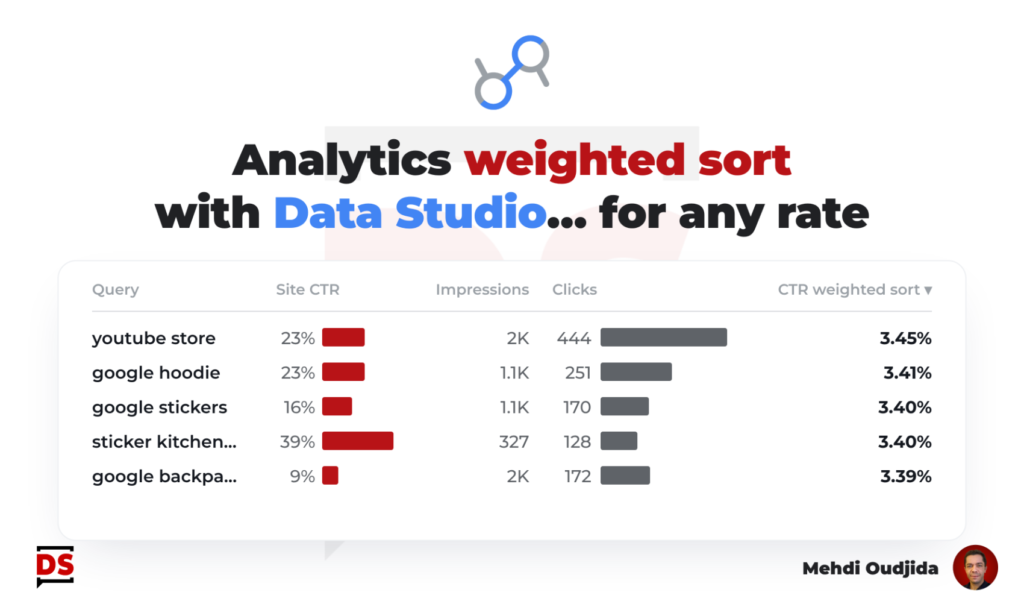
Weighted sort was a nice feature from Google Universal Analytics table charts. Adjusting the sorting to inject the importance of
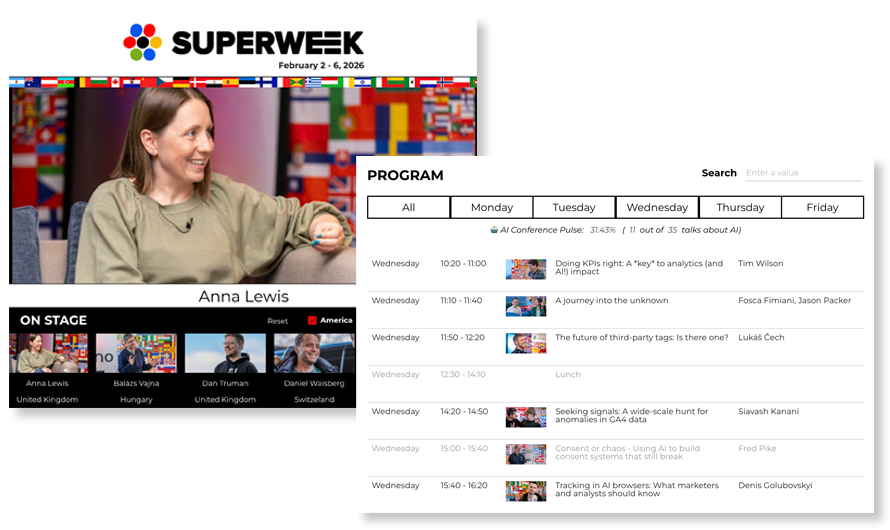
2026 Edition As I do every year ahead of Superweek Analytics Summit, I rolled out a new version of my