
Data Studio Vs Looker Studio with Google Trends data
Looker Studio becomes Data Studio…again Shortly after the announcement of Looker Studio being renamed back to Data Studio, I thought
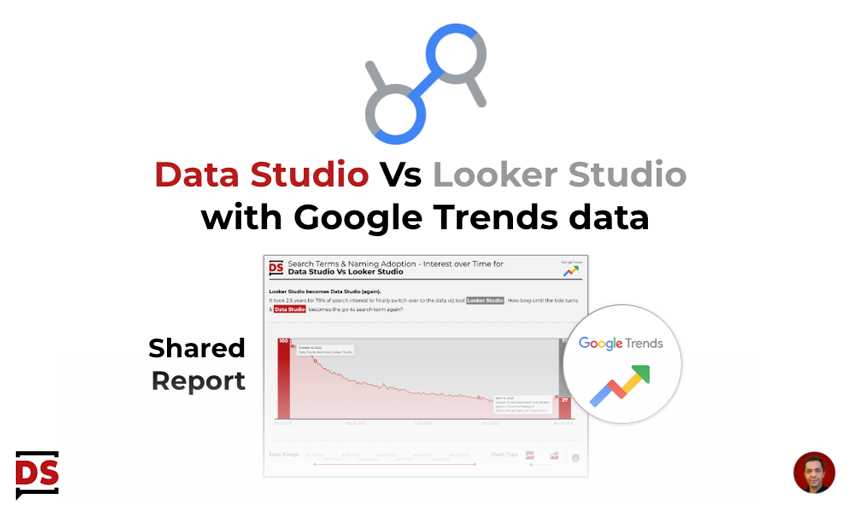
Looker Studio becomes Data Studio…again Shortly after the announcement of Looker Studio being renamed back to Data Studio, I thought
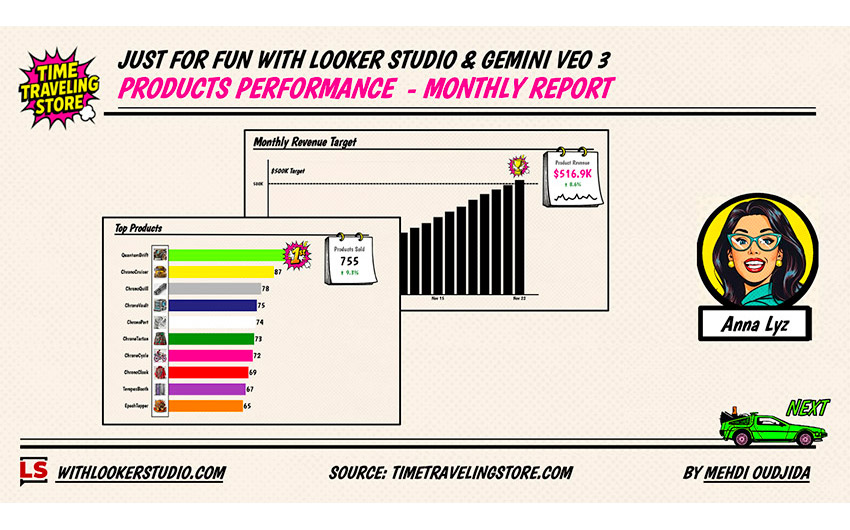
A few months ago I created a just-for-fun report that displays product ranking data and track the associated volatility. At
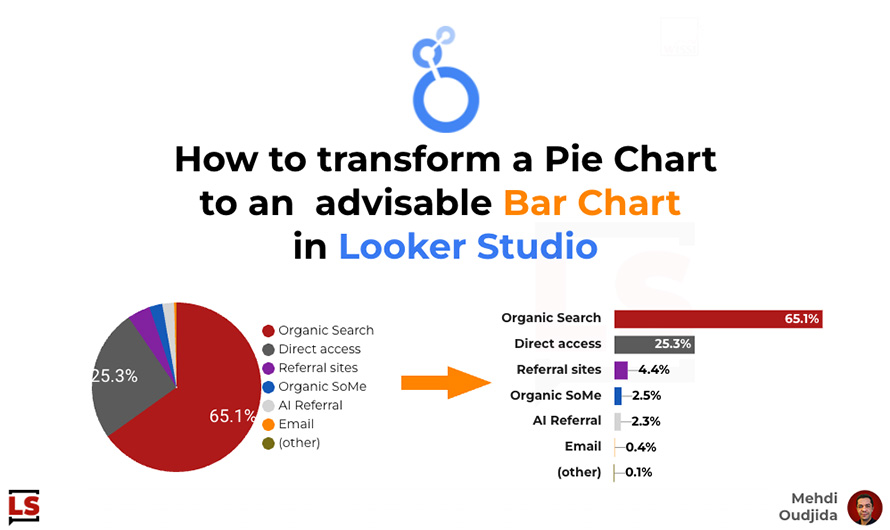
Let’s go back to Data Viz basics and related good practices. “I understand, you like pie charts but let me
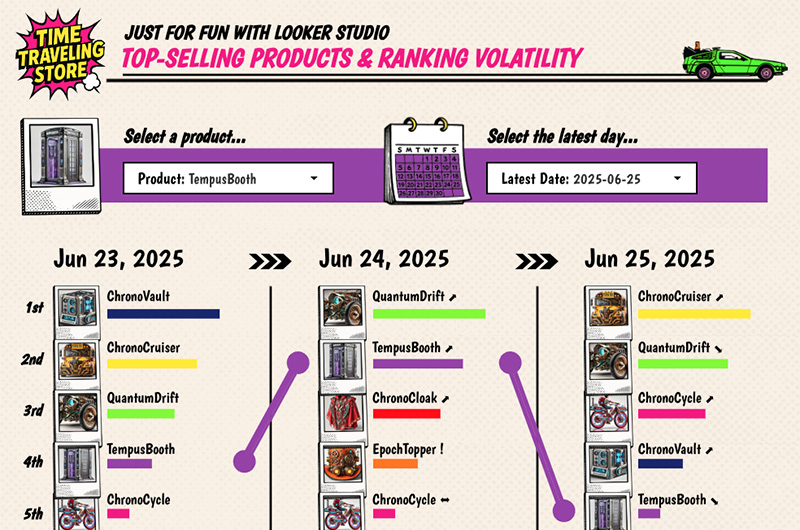
Here comes a new just-for-fun shared report designed with Looker Studio. This time, we are going to talk about visualisation
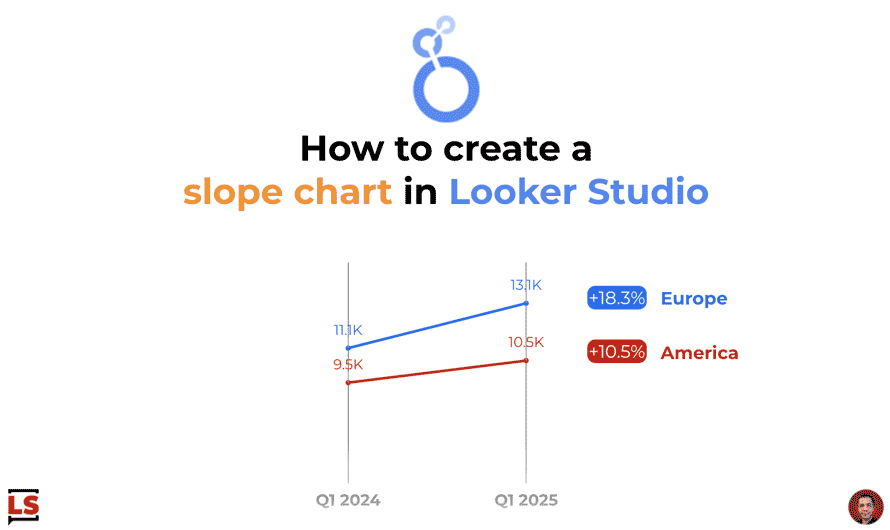
Let’s take advantage of the new style capabilities released yesterday to create a nicer slope chart than before with line
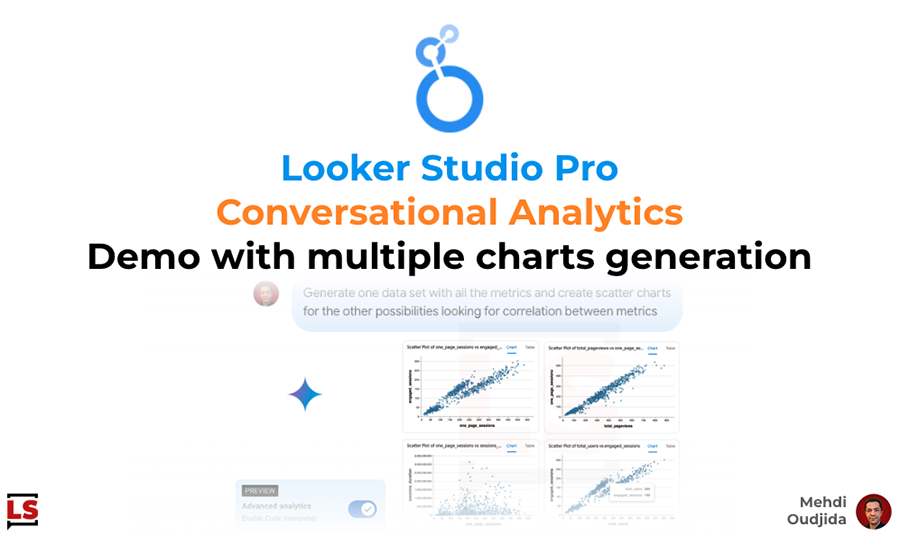
Ready to talk with your data? 🤌🏻 Here a new exciting demo of Looker Studio Pro Conversational Analytics – currently
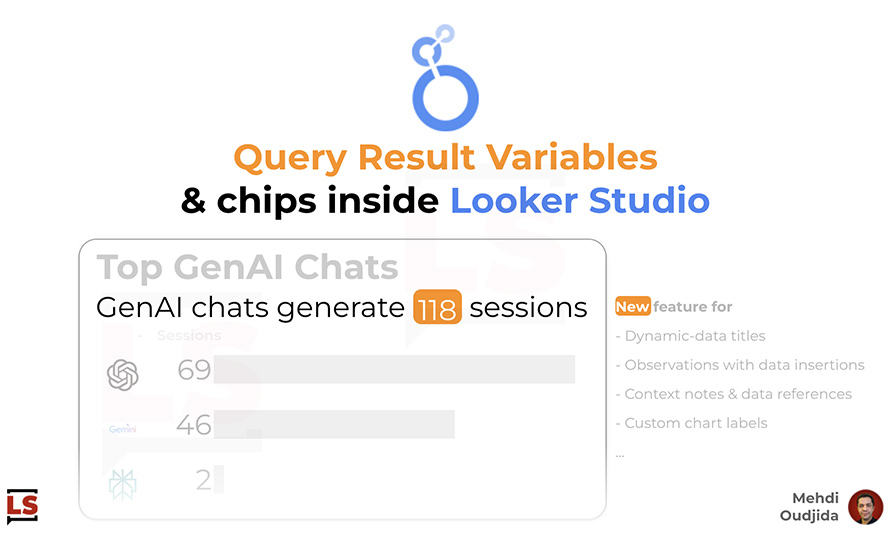
Let’s discover “Query Result Variables” or “Chips” inside Looker Studio, a freshly released feature at the same time than 2
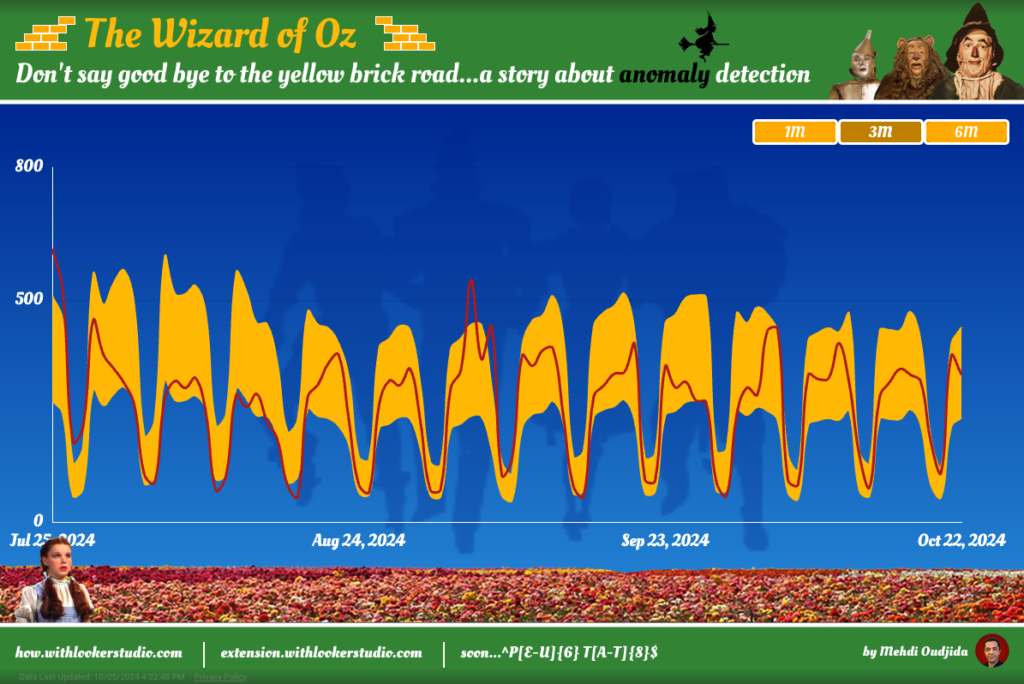
The story begins with the need to graphically represent metric variations and the related expected range values in Looker Studio.
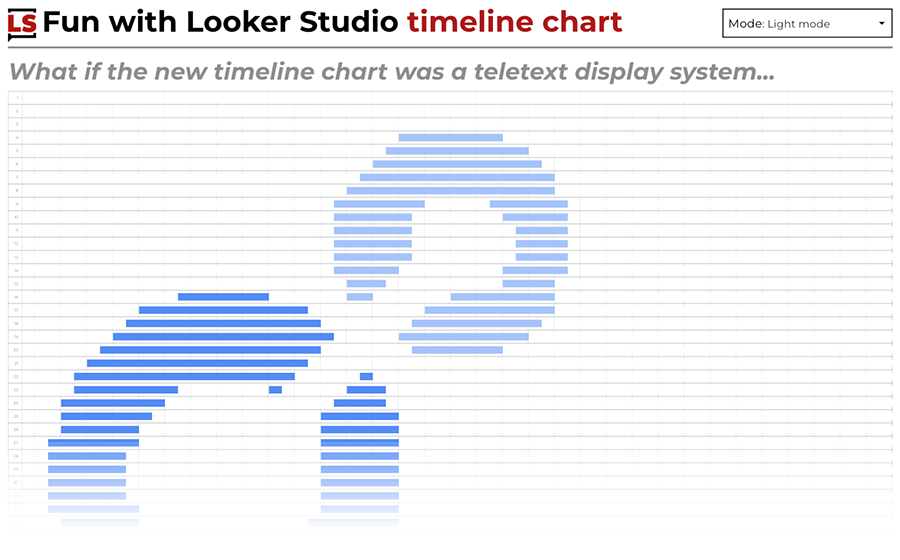
As you probably already know, a new chart type has been released last week by the Looker Studio team: Timeline
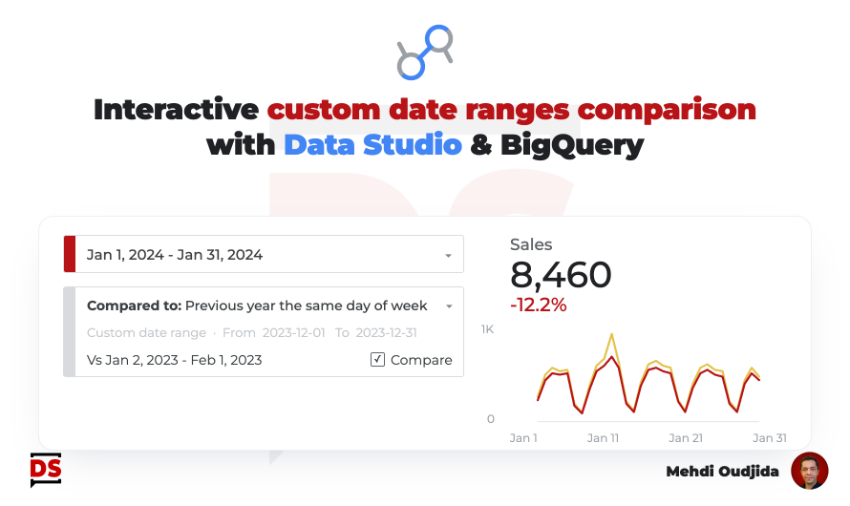
Two years ago, I started working on this interactive comparison date range solution within Data Studio, to fill a gap