
How to insert a glossary in your Data Studio report
“What does this metric mean exactly?” If you build reports for other people, you have heard this question many times.
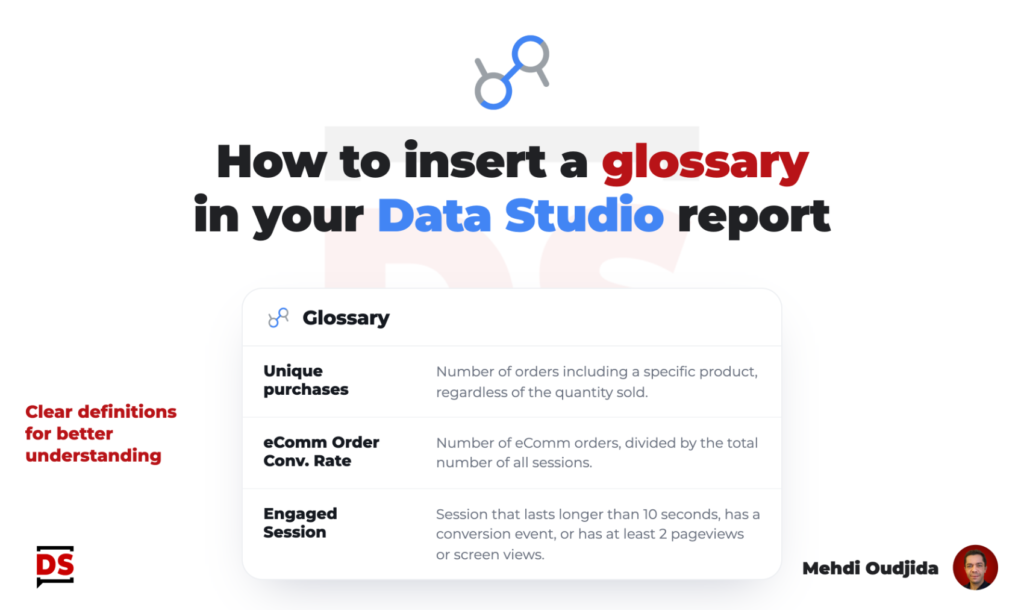
“What does this metric mean exactly?” If you build reports for other people, you have heard this question many times.
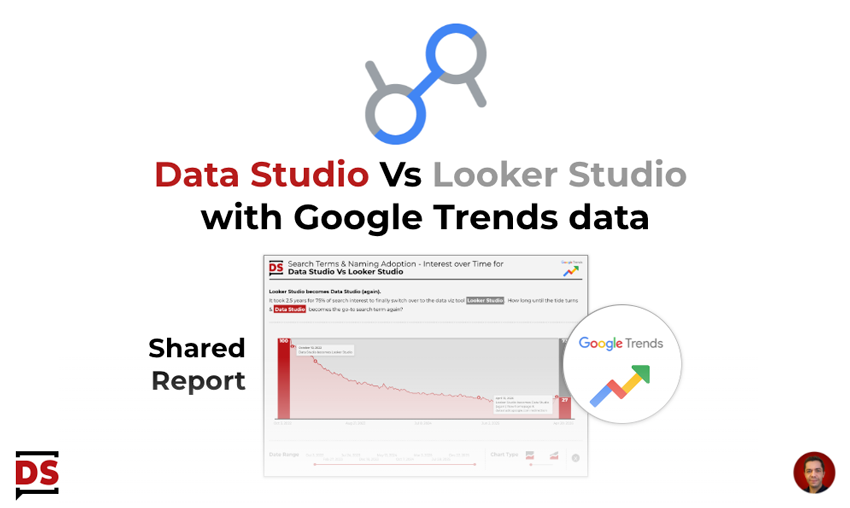
Looker Studio becomes Data Studio…again Shortly after the announcement of Looker Studio being renamed back to Data Studio, I thought
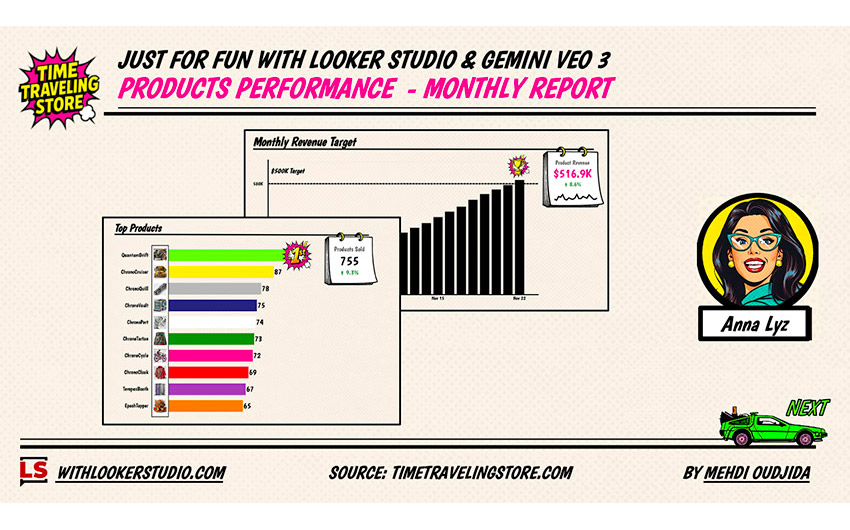
A few months ago I created a just-for-fun report that displays product ranking data and track the associated volatility. At
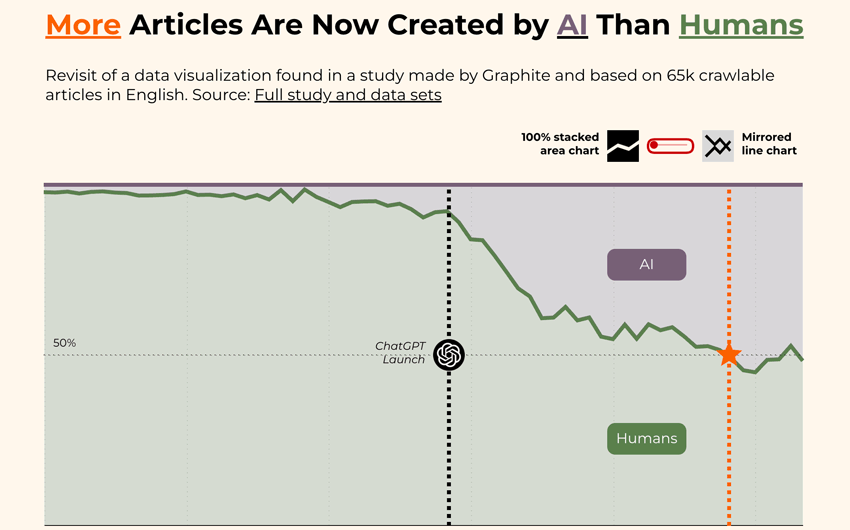
I’m not a big fan of mirrored line charts and that’s putting it mildly. Mirrored Line Charts I completely understand
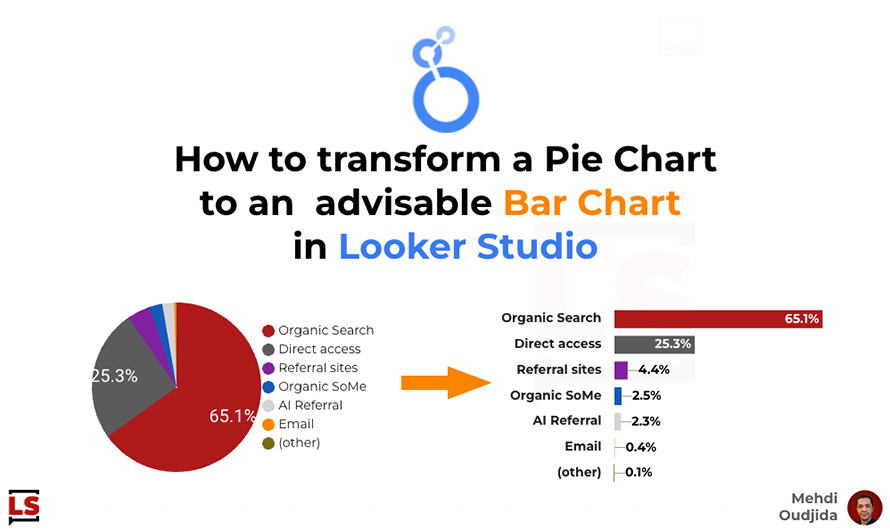
Let’s go back to Data Viz basics and related good practices. “I understand, you like pie charts but let me
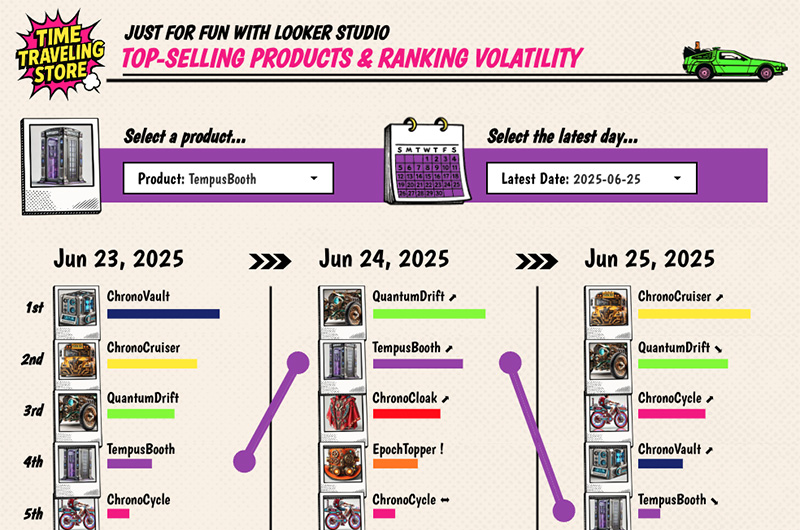
Here comes a new just-for-fun shared report designed with Looker Studio. This time, we are going to talk about visualisation
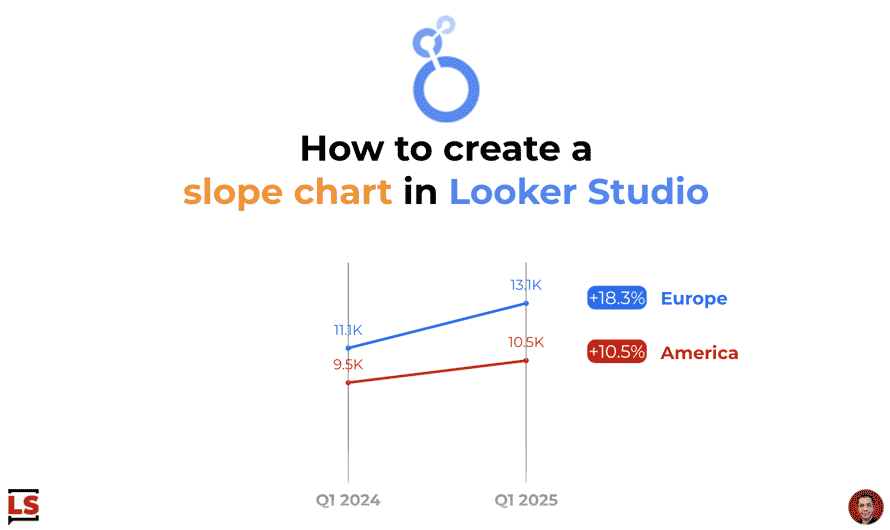
Let’s take advantage of the new style capabilities released yesterday to create a nicer slope chart than before with line
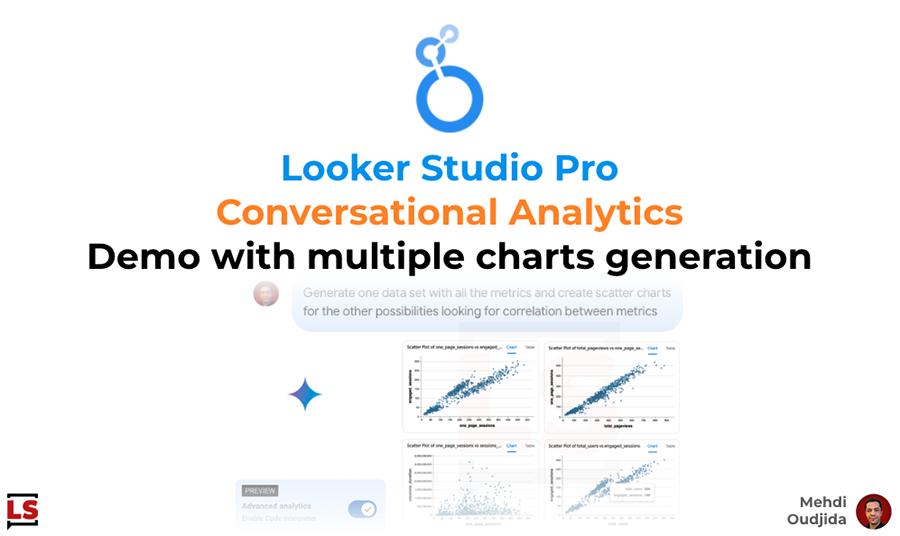
Ready to talk with your data? 🤌🏻 Here a new exciting demo of Looker Studio Pro Conversational Analytics – currently
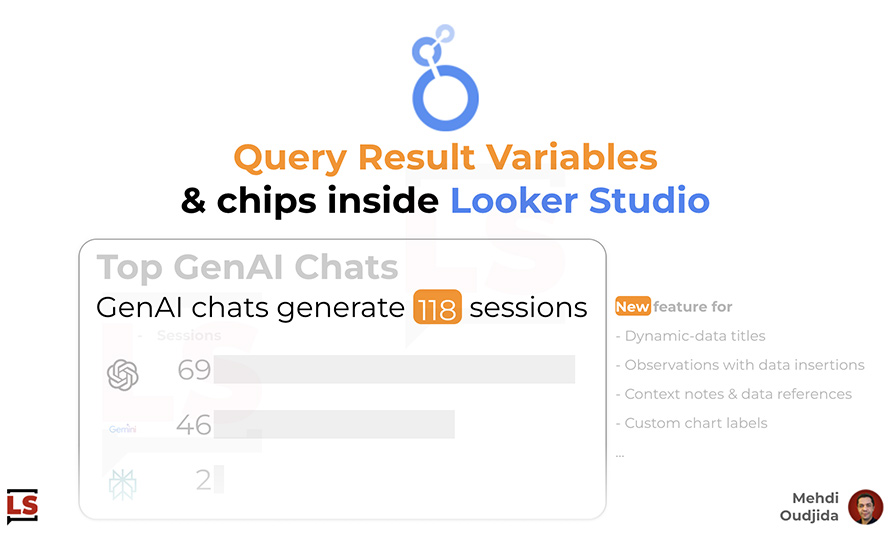
Let’s discover “Query Result Variables” or “Chips” inside Looker Studio, a freshly released feature at the same time than 2
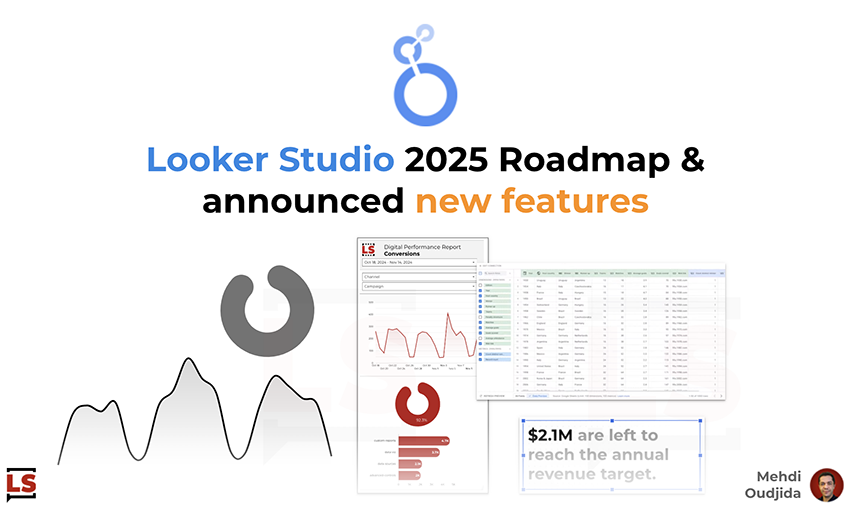
Few days ago, the Google Cloud BI team introduced the roadmap of Looker & Data Studio (ex Looker Studio) products.