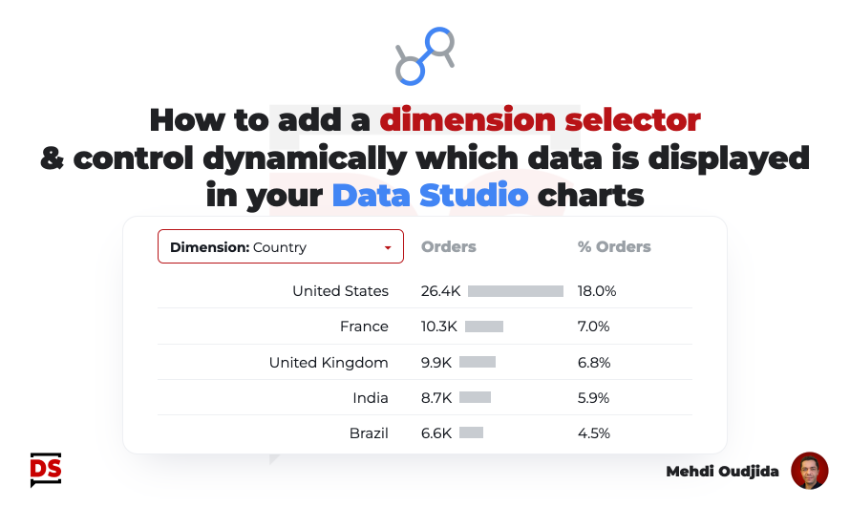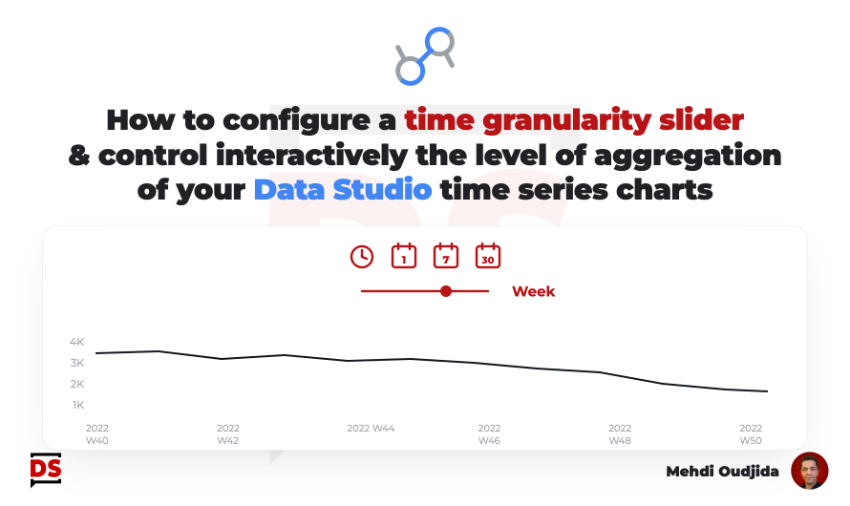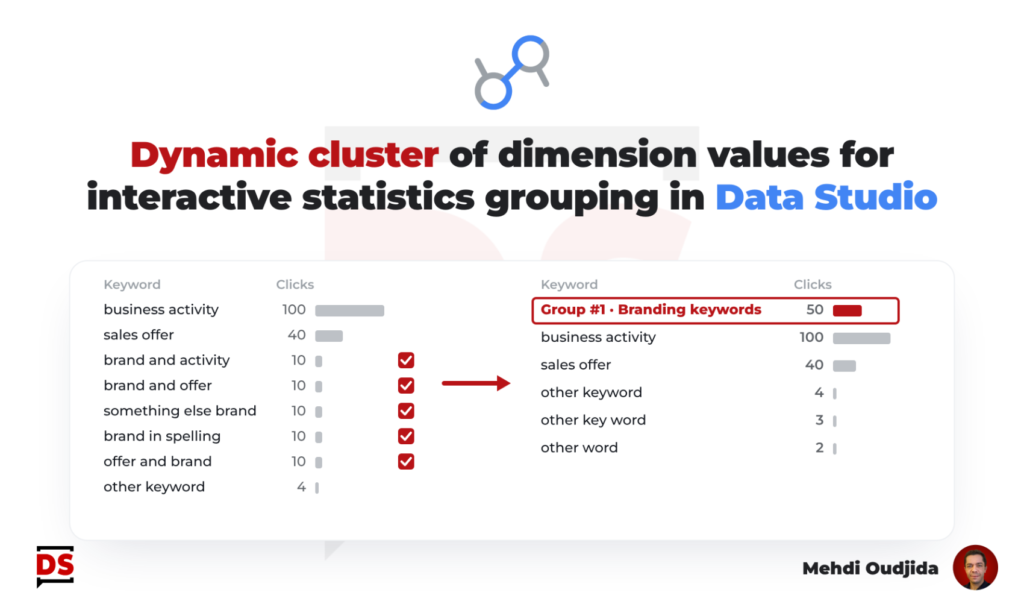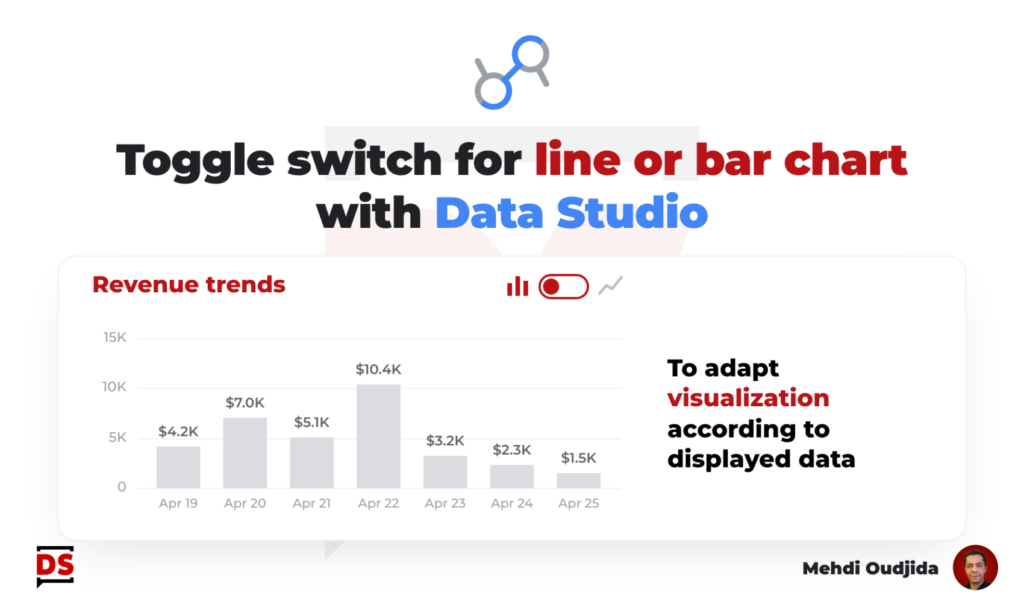
Let’s continue the exploration of Google Data Studio parameter feature with this new example. This time, we will combine parameter & related control with the new “IF” function, released last month (March 11, 2021). We will build a simple trend chart and create a control to switch between line and bar chart, designed like a toggle-switch.
As example, it could be useful to display bars for short series Vs draw line if there are a lot of data points.
Unlock free access to the full article
Access to this article written by Mehdi Oudjida, Data Studio Expert, is completely free: enter your email address to receive an access link to the full article.
Your email address is only used to send the link, and for the newsletter if you tick the box. It is not stored on this site.