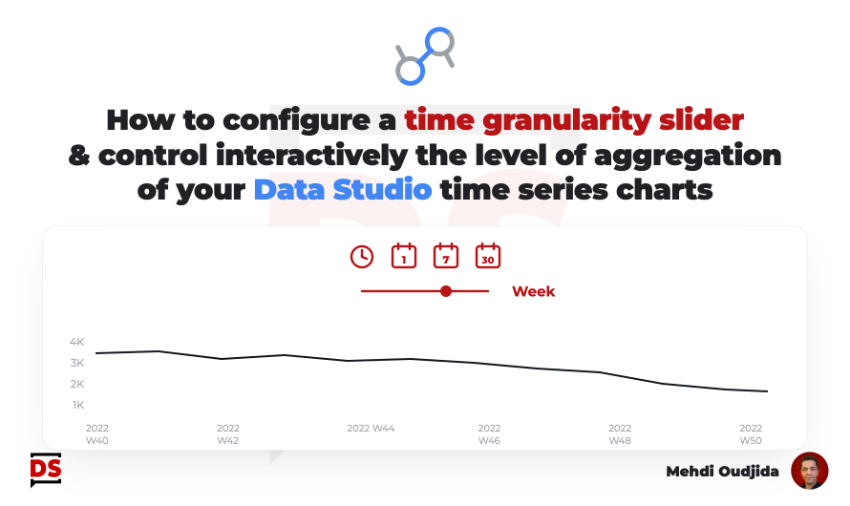
Why building a time granularity slider? I’m really disappointed when Data Studio (ex Looker Studio) reports – made for weekly or monthly data – are used with a date range of one day, especially when we talk about time series charts and related trends…disappearing…and becoming a kind of simple score card, lost in the space.
The opposite is also true: A time series chart with plots and labels is easily overloaded if the selected date range is too large.
So, let’s try to provide some controls on time series chart to change the time dimension for greater clarity or more time granularity, switching as example from daily plots to hours if we select only one day of data.
It is an opportunity to use the amazing parameter feature. Comparing to my article about primary and secondary dimension selection, we will use the same kind of mechanism to select dimension through parameter. but this time, we will play with slider control and date formats.
Unlock free access to the full article
Access to this article written by Mehdi Oudjida, Data Studio Expert, is completely free: enter your email address to receive an access link to the full article.
Your email address is only used to send the link, and for the newsletter if you tick the box. It is not stored on this site.