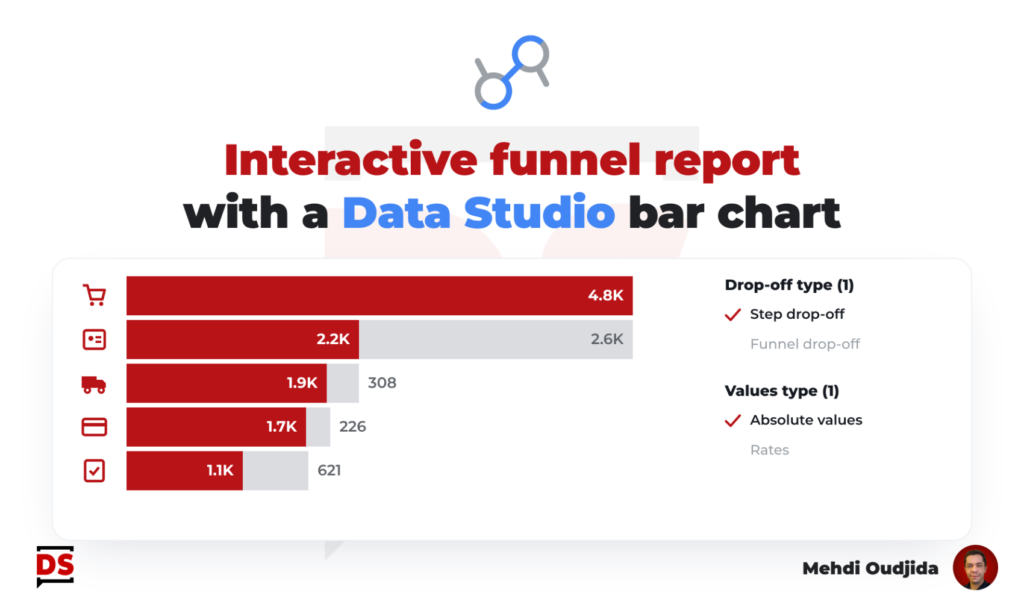
Last year, I wrote an article describing how to build a simple funnel chart with a single table chart. A way to demonstrate in Data Studio (ex Looker Studio…should I continue to specify it) that we don’t need 20 chart elements to build this kind of visualisation with steps, absolute values, drop-offs, rates…
This time, I propose to inject interactivity as part of the design concerns of funnel report creation. Let’s include 2 controls:
- Type of value to display
- Absolute values fo data volume, and so context
- Vs
- Rates for steps comparison and performance
- Type of drop-off to display
- Step drop-off regarding the previous step
- Vs
- Funnel drop-off, so the cumulated exits from the funnel for each step
The 4 combinations of these options can provide insights. Choosing to display one at the time could help for reading and exploration.
Unlock free access to the full article
Access to this article written by Mehdi Oudjida, Data Studio Expert, is completely free: enter your email address to receive an access link to the full article.
Your email address is only used to send the link, and for the newsletter if you tick the box. It is not stored on this site.