
How to transpose columns of metrics to rows inside a Data Studio table chart
The quick tip below describes how to transpose Data Studio (formerly known as Looker Data Studio) table charts composed with
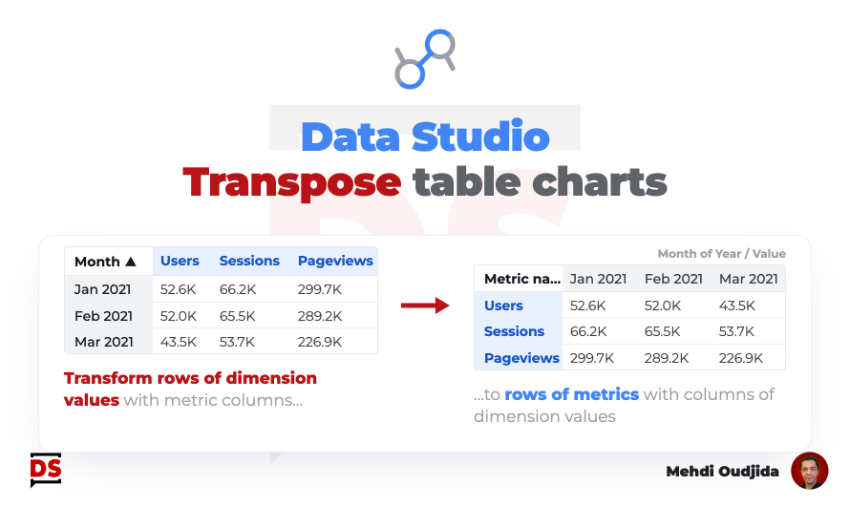
The quick tip below describes how to transpose Data Studio (formerly known as Looker Data Studio) table charts composed with
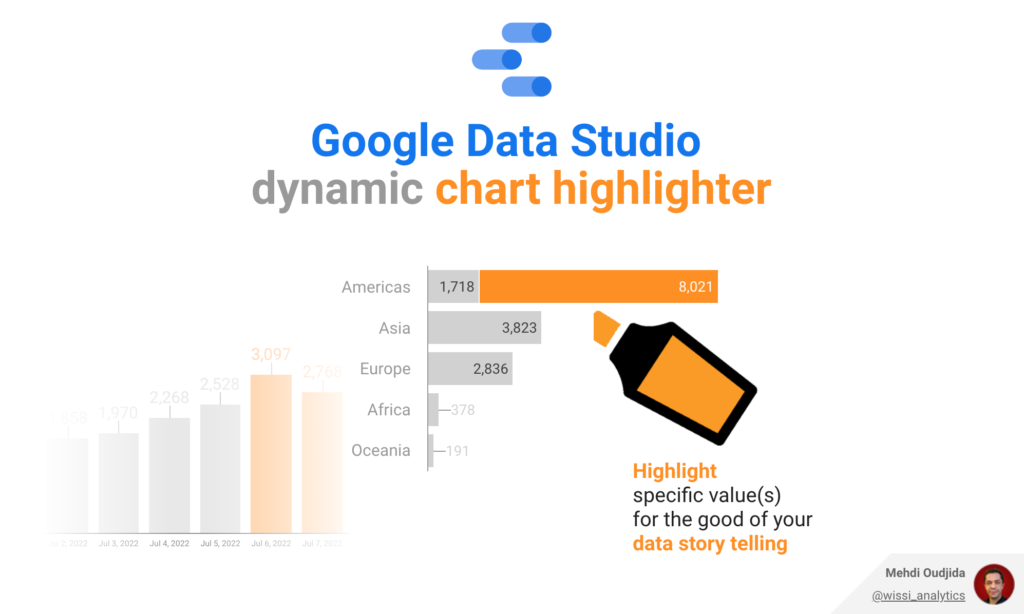
Conditional formatting is typically a very good automatic highlight system for dashboards to read fast and see what it is
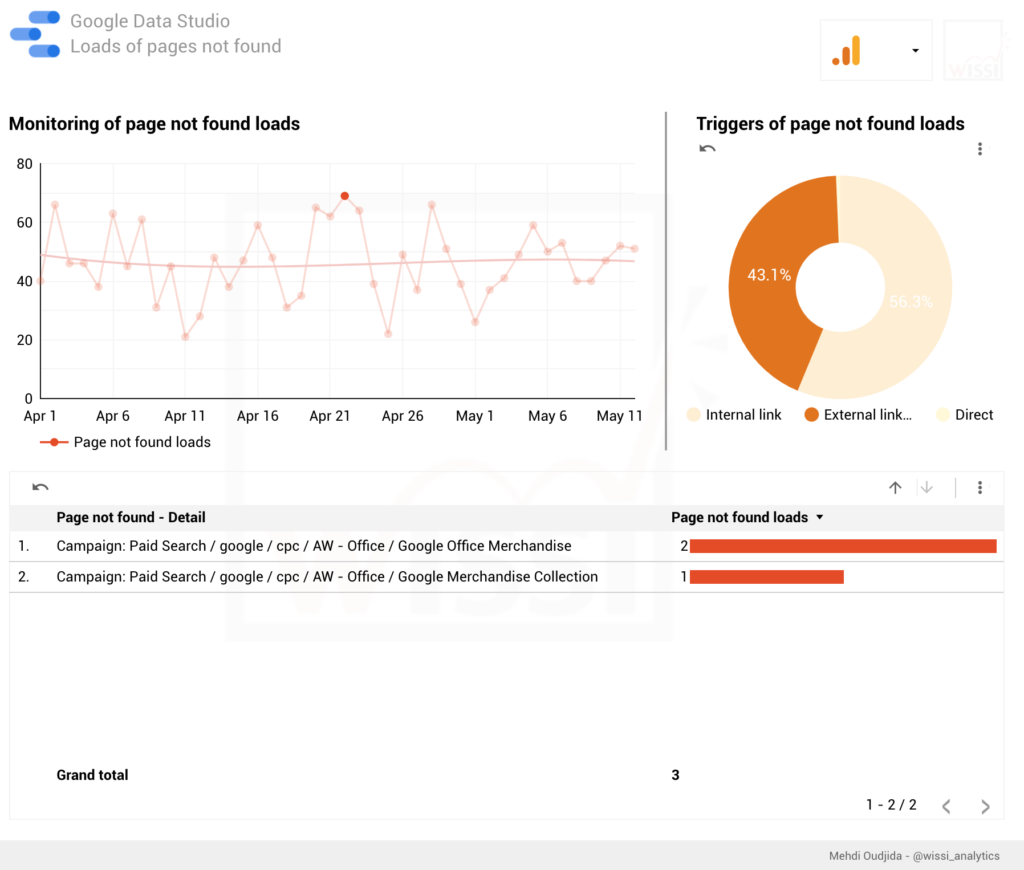
Google Data Studio can help you to address a lot of challenges of dashboarding, reporting or data story telling. You
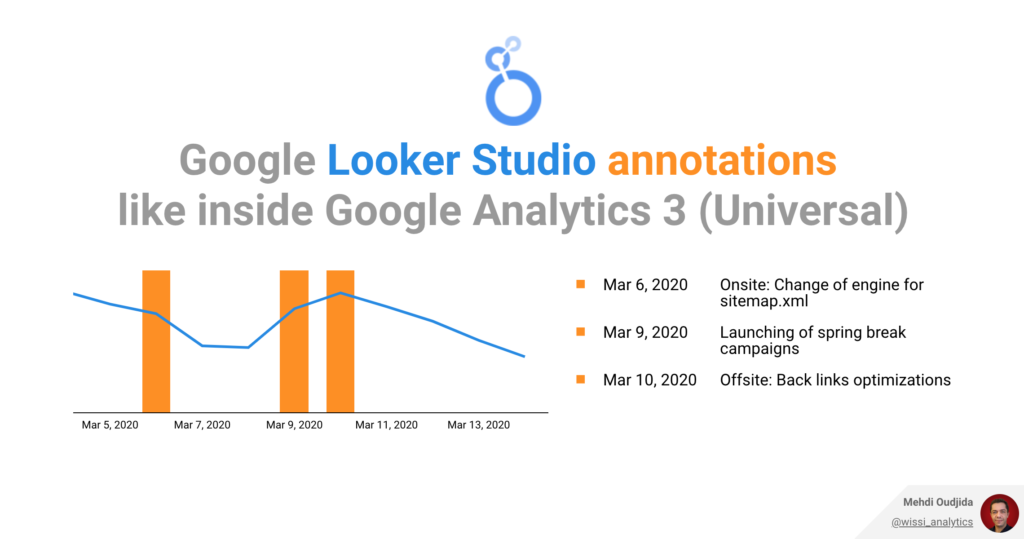
Marketers & website owners use to fill annotations inside Google Analytics Universal, adding temporal context to data with external events.