Of course, nothing is better than getting cleaned, organized and grouped data to build beautiful dashboards with Google Data Studio and other data viz tools.
But messy data is also our daily lives. At some point (the best reason), because we are in charge actually to clean it or to create an efficient measurement plan.
Data Studio can also help you – without coding skills – to explore and test any data, at any stage of data analysis. And data exploration can significantly be accelerated with home made tools.
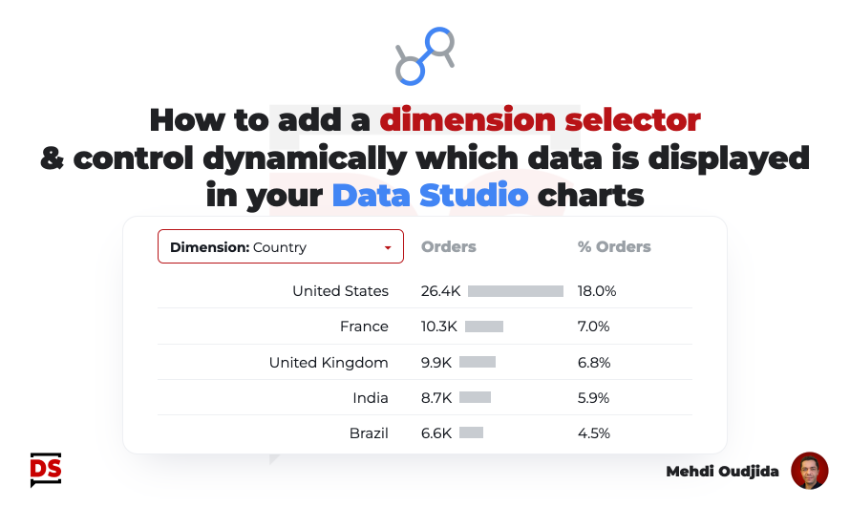
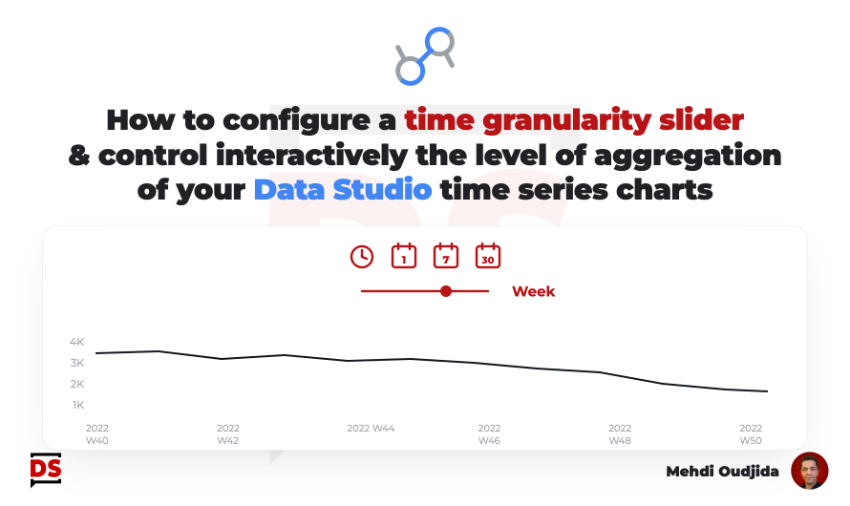
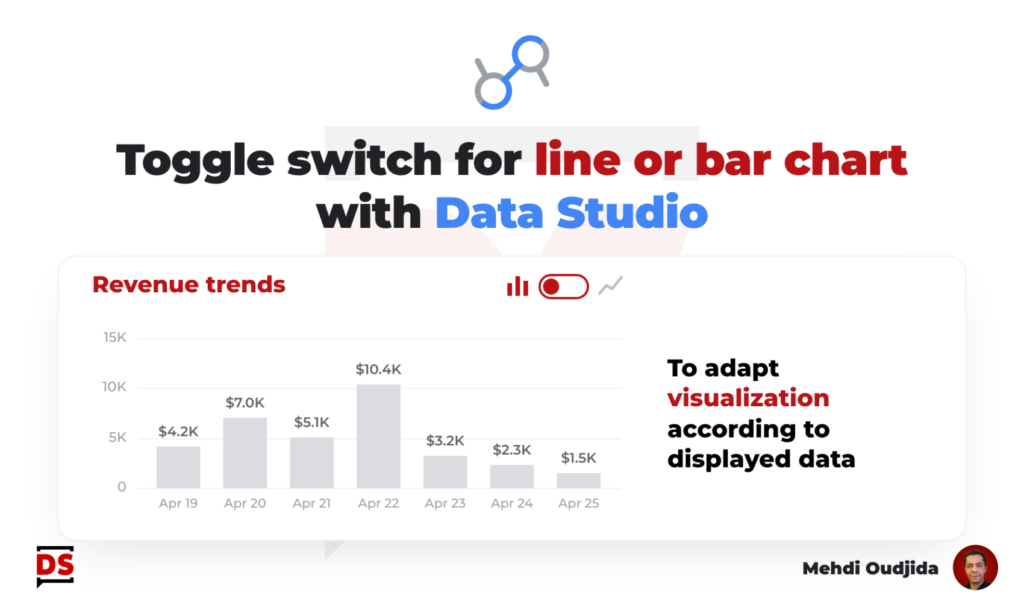
As example, the capability to cluster dynamically existing data is possible with Data Studio. It will help you to identify trends and apply the better options for the future.
How many times you read a table chart, saw the high number of values (with the related long tail of descending metric values) and suspect that a cluster of values with a common denominator could be significant, driving your analysis or your way to organize your data? 🧐
Let’s build a simple & interactive report that help you to cluster your data and create soft grouping inside Data Studio!
Unlock free access to the full article
Access to this article written by Mehdi Oudjida, Data Studio Expert, is completely free: enter your email address to receive an access link to the full article.
Your email address is only used to send the link, and for the newsletter if you tick the box. It is not stored on this site.