Let’s go back to Data Viz basics and related good practices.
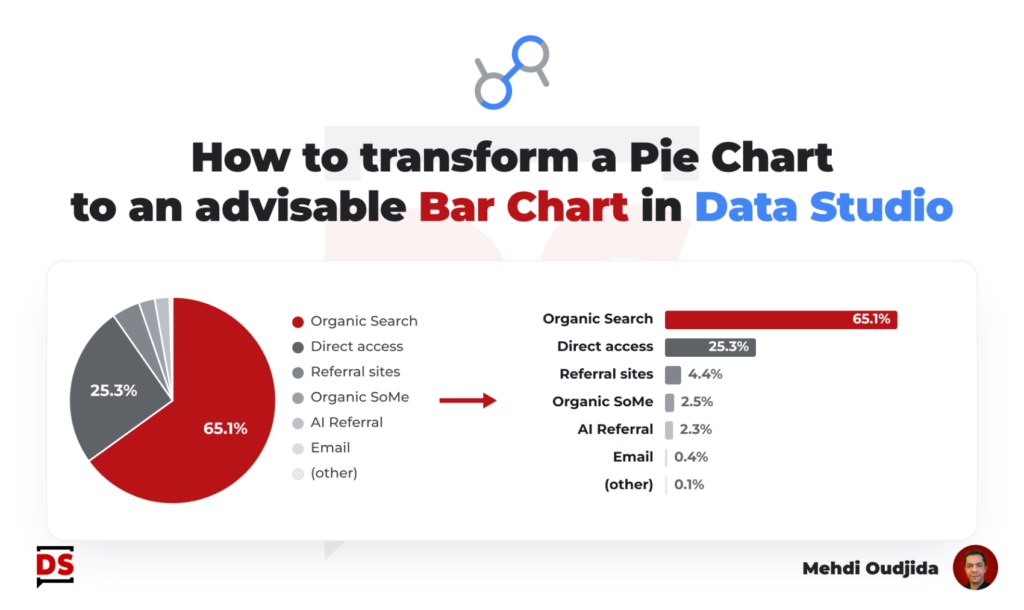
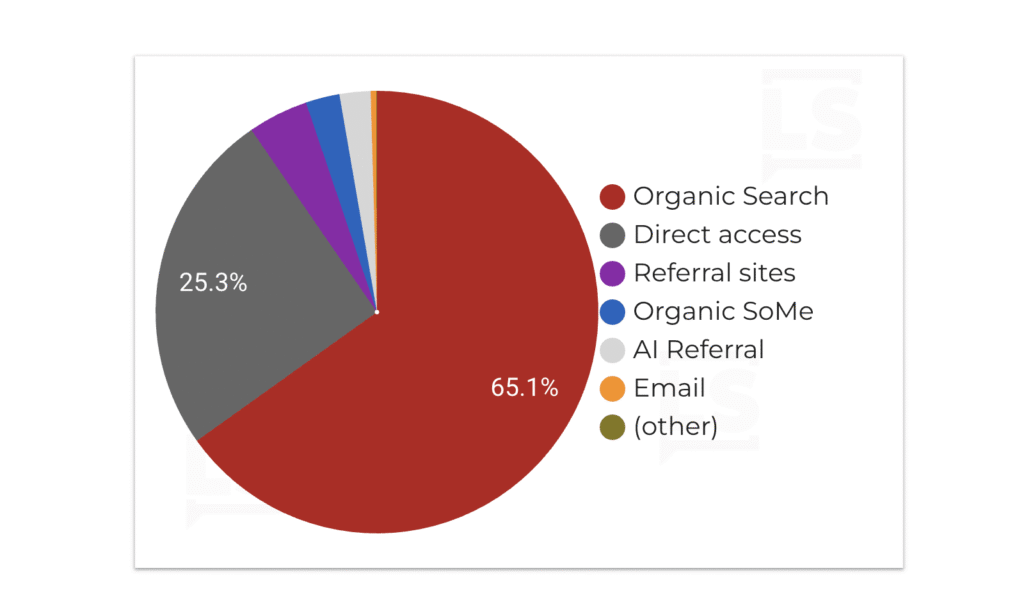
“I understand, you like pie charts but let me propose you an alternative before deciding”
I’ve had to say this sentence many times, and I imagine you have too. So, here’s how I usually replace that pie chart with a bar chart using Data Studio modern-ized charts.
Unlock free access to the full article
Access to this article written by Mehdi Oudjida, Data Studio Expert, is completely free: enter your email address to receive an access link to the full article.
Your email address is only used to send the link, and for the newsletter if you tick the box. It is not stored on this site.