
The Wizard of Oz – The Yellow Brick Road, a story about anomaly detection
The story begins with the need to graphically represent metric variations and the related expected range values in Looker Studio.
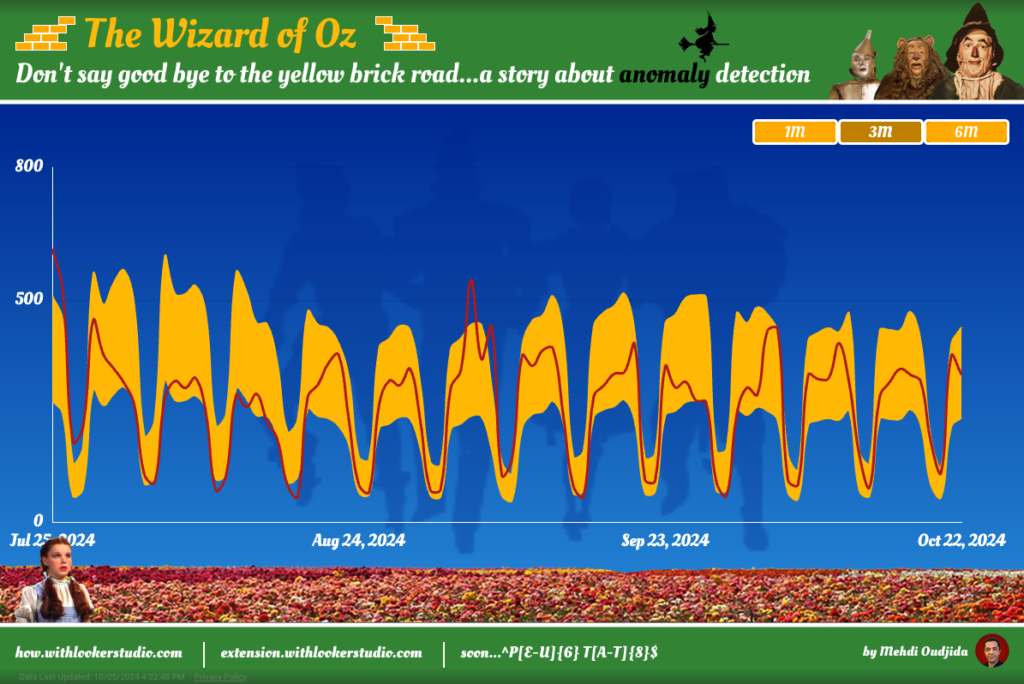
The story begins with the need to graphically represent metric variations and the related expected range values in Looker Studio.
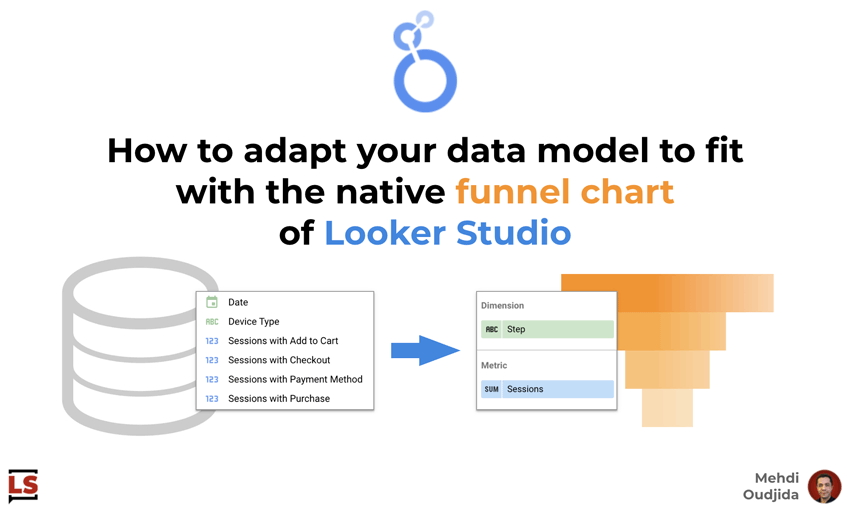
Last week, the Looker Studio team has released a new chart type: The funnel chart! All the users community on

The Looker Studio calculated field below cleans a text field removing any HTML tag.
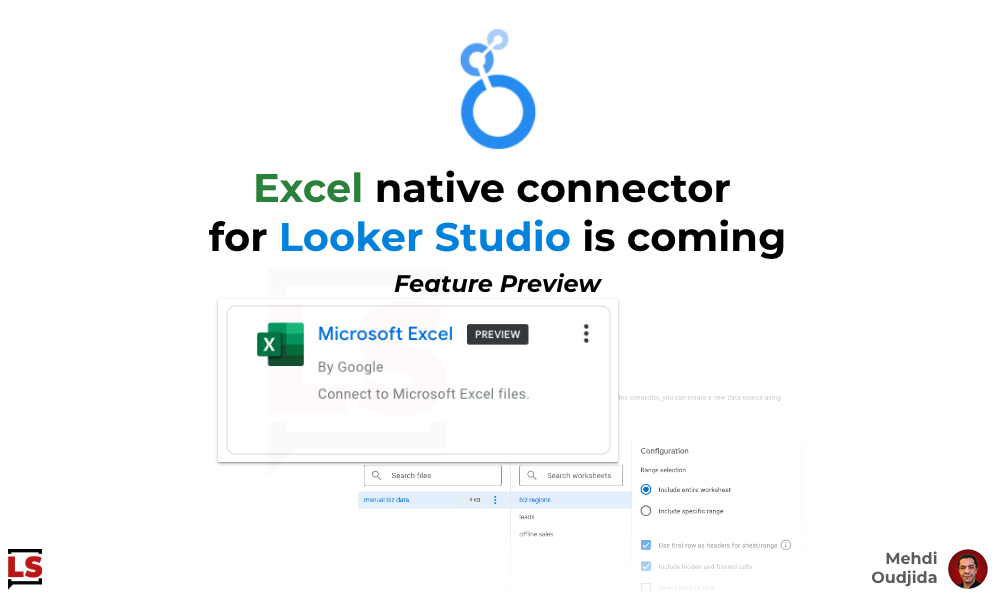
Excel-ling Now, you are thinking that July is the month of feature previews for Looker Studio. It is not wrong,

Yesterday, we saw with a real life use case how the Formula Assistant will help us to build calculated fields
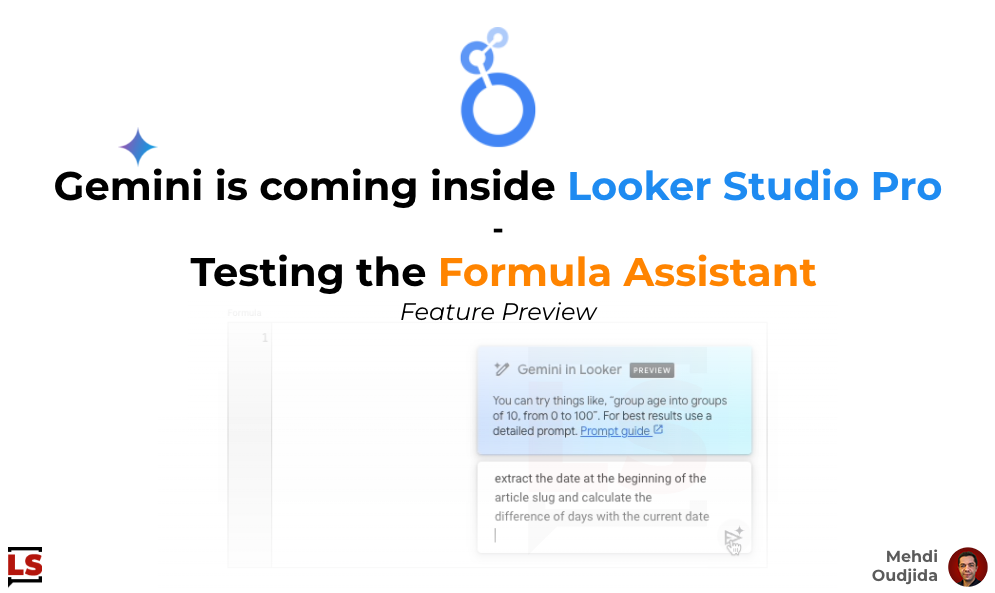
Gemini is coming inside Looker Studio Pro and Looker BI. Few months ago, a restricted preview program gave a chance
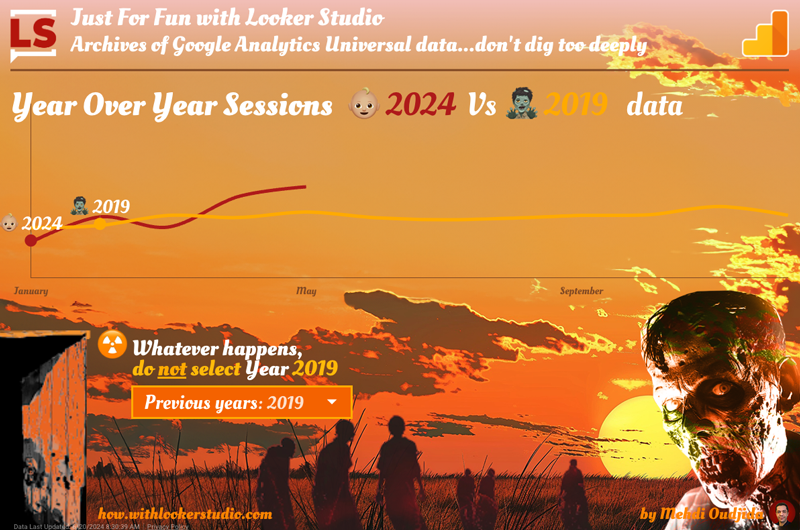
As any Google Analytics practitioner, you made some archives of GA Universal data and are ready for the full sunset
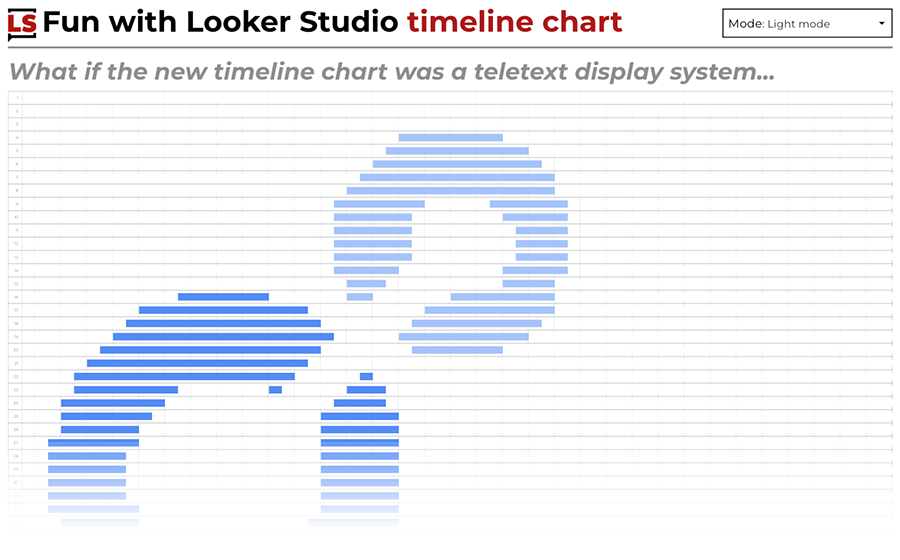
As you probably already know, a new chart type has been released last week by the Looker Studio team: Timeline
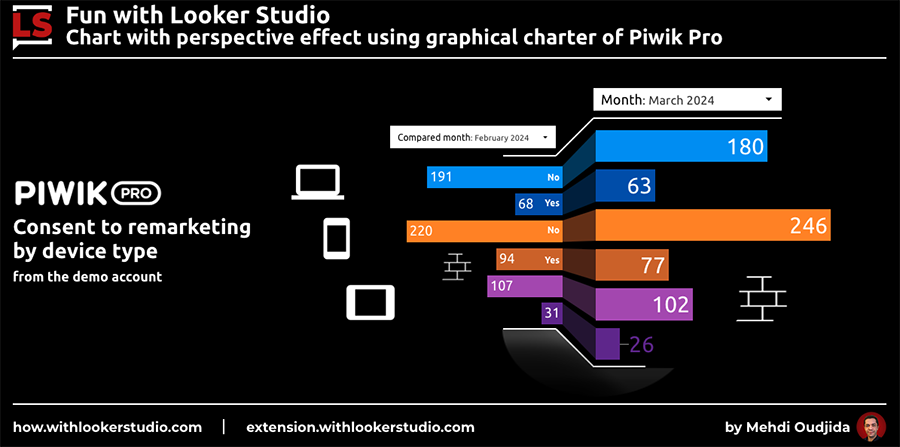
I like the graphical charter of Piwik Pro and had an idea discovering the new video series “25 years of
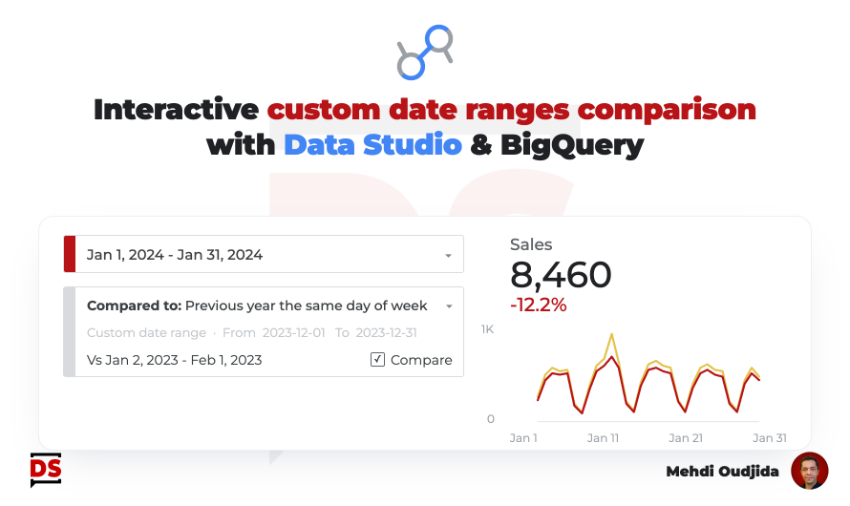
Two years ago, I started working on this interactive comparison date range solution within Data Studio, to fill a gap