Keeping charts as simple as possible is very challenging. For some cases, a single interactive feature can offer a first level of data exploration or calculation without overloading the default state of your Data Studio (formerly Looker Studio) chart.
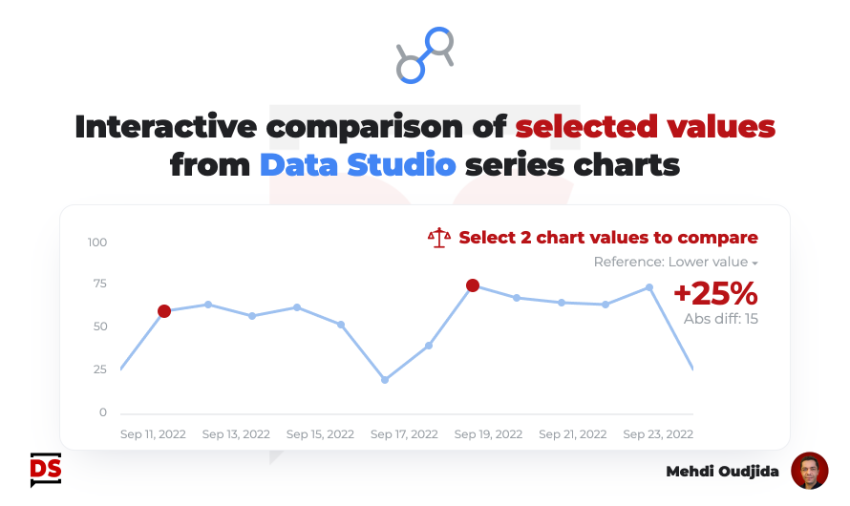
In this article, I will describe an home made custom solution to give a way for readers to quickly calculate the difference between 2 selected values, available in a series charts. Quite simple & efficient, displaying the big picture by default, but also an option to compare values with absolute and relative difference to help for deviation or comparison first explorations.
Unlock free access to the full article
Access to this article written by Mehdi Oudjida, Data Studio Expert, is completely free: enter your email address to receive an access link to the full article.
Your email address is only used to send the link, and for the newsletter if you tick the box. It is not stored on this site.