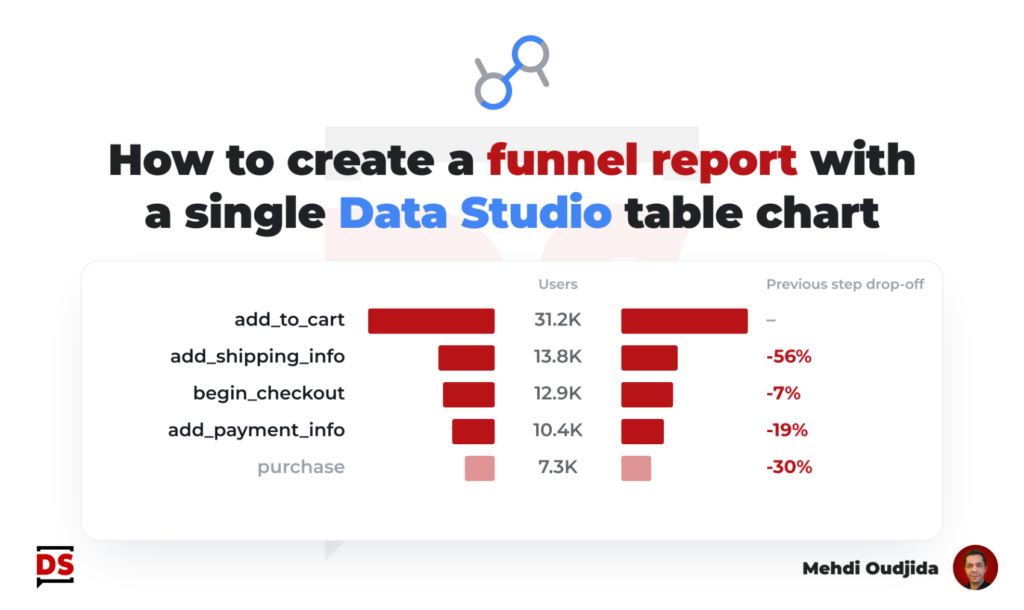
Funnel report type inside Data Studio, a recurring need for a popular visualization. There are a lot of solutions, templates, articles describing how to do. Most of these resources are nice and address the visualisation need. Technically speaking, they are based on scorecards with dedicated blended data to calculate each step-over-step rate or the related dropoff.
In these same examples, the steps with absolute metric values are often designed with a bar chart or with other scorecards.
So the full funnel report requires a lot of elements (charts, blended data, filters, shapes, and sometimes segments…so also multiple specific data loading as the consequence of all these elements).
We know how any additional element can degrade the performance of the report loading for readers, and even more for report editors. So, we need to keep in mind what happens behind the scenes to display queried data regarding our design choices.
As a solution to take care of performance and to go back to simple things, in this post, I describe how to built a funnel report – with the same data described above – BUT with a single table chart and the fewest configuration elements.
For the example, I choose to use a Google Analytics 4 data set, based on e-commerce event names and related users. But as usual, you can use any funnel data from any source (pages, stages, journey steps…).
Unlock free access to the full article
Access to this article written by Mehdi Oudjida, Data Studio Expert, is completely free: enter your email address to receive an access link to the full article.
Your email address is only used to send the link, and for the newsletter if you tick the box. It is not stored on this site.