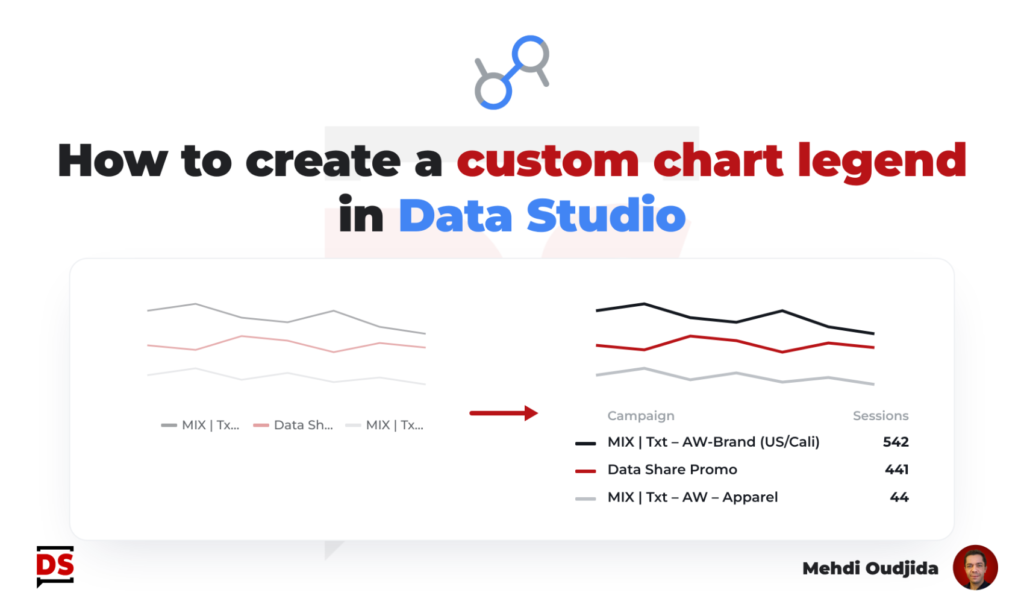
For a lot of cases, legends are not the best visualization solution for line chart (and similar trends chart types). Often, the chart and related data are simple BUT complicated to read because of it requires back and forth to understand what metric or segment is concerned by the displayed trends.
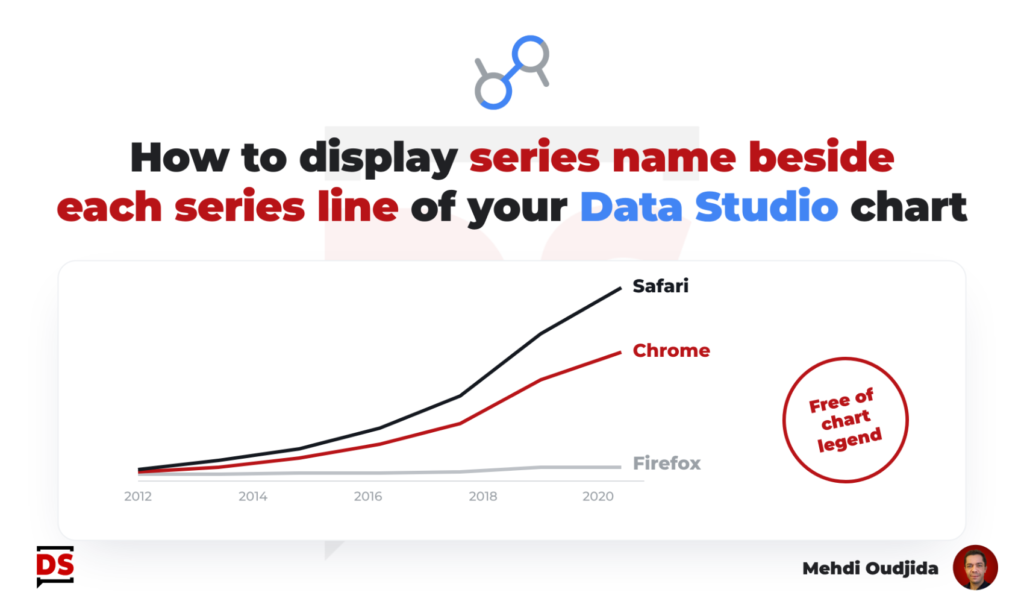
Best practices of data visualisation would recommend to turn off chart legend and display series names beside series lines.
Unfortunately, it is not (yet) available inside Google Data Studio as a built-in feature.
But as usual, not available doesn’t necessary mean not possible. I created my own custom recipe to address this data viz need 🙂
In this post, I share how to add series names – corresponding for most of cases to dimension values – for your trends charts inside Google Data Studio.
The described example is based on basic Google Analytics data (evolution of sessions by category device) but you can apply the recipe of tricks to any data set of trends, with any time granularity.
Unlock free access to the full article
Access to this article written by Mehdi Oudjida, Data Studio Expert, is completely free: enter your email address to receive an access link to the full article.
Your email address is only used to send the link, and for the newsletter if you tick the box. It is not stored on this site.