
Google Data Studio – Pie chart & donut chart for your standalone rate metric
The purpose of this article is not to debate about the right cases & visualisation opportunities to use controversial pie
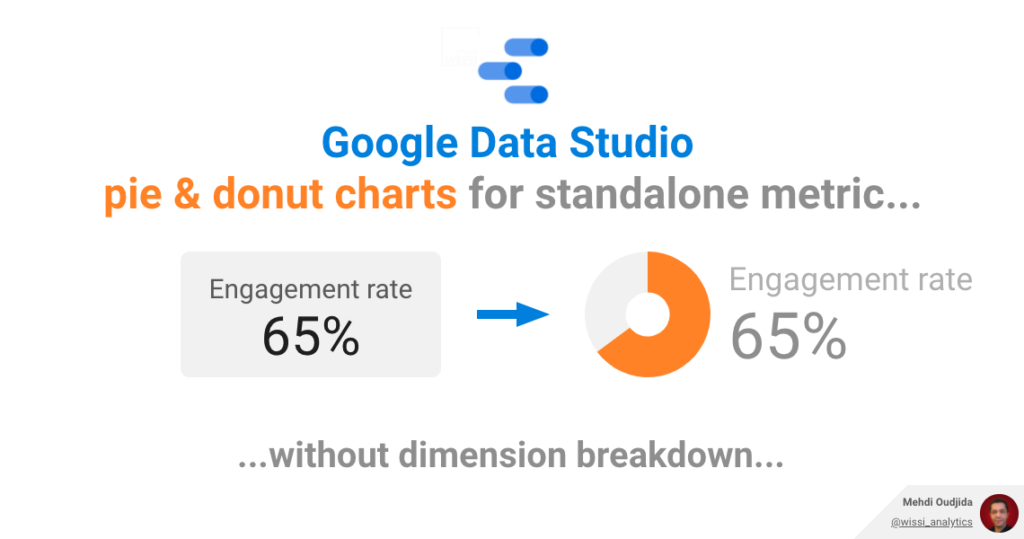
The purpose of this article is not to debate about the right cases & visualisation opportunities to use controversial pie
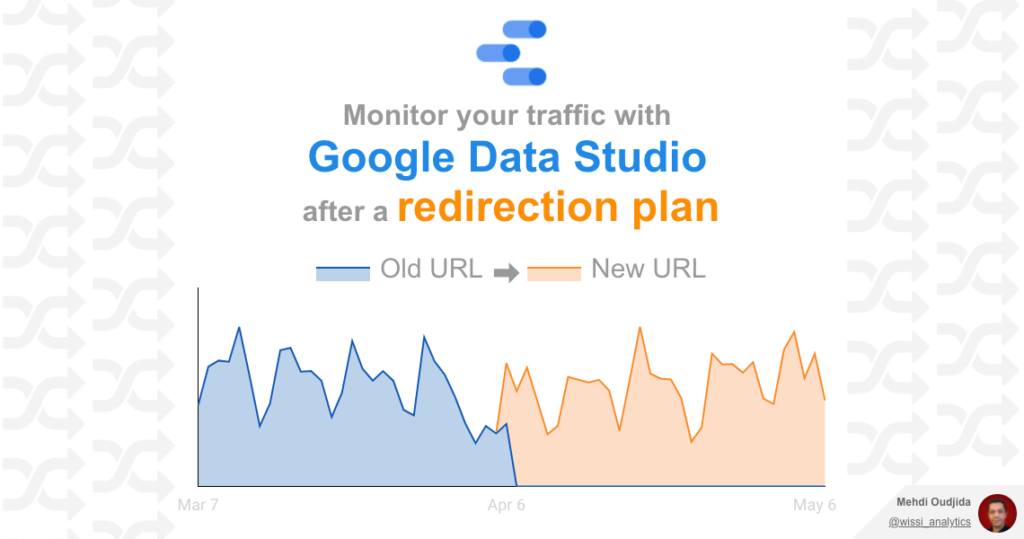
The preparation & the deployment of a URLs redirection plan require method, know-how, a lot of rigor of execution, involving
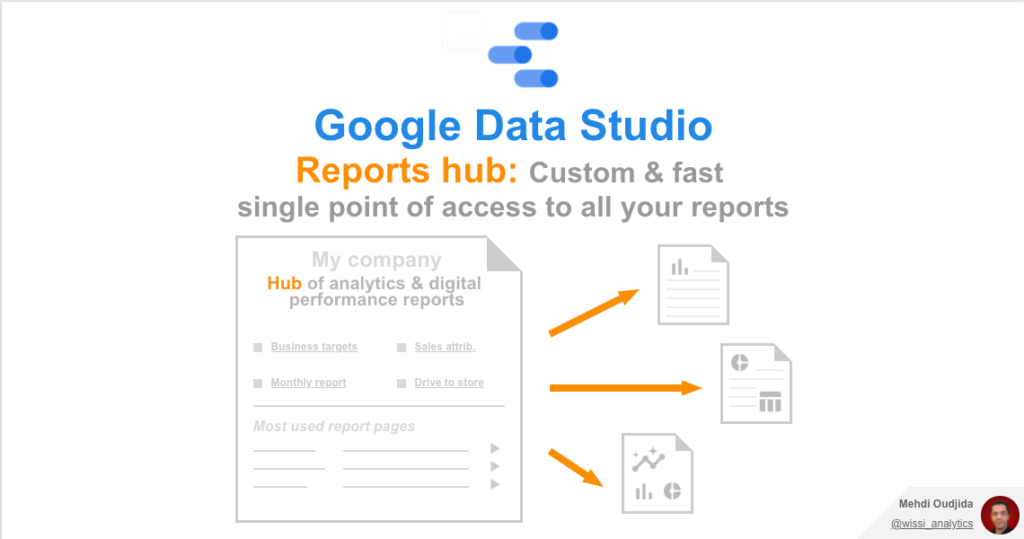
Within your organisation, dashboards and reports multiply to address various needs of analytics & digital performance. Some (most) of them
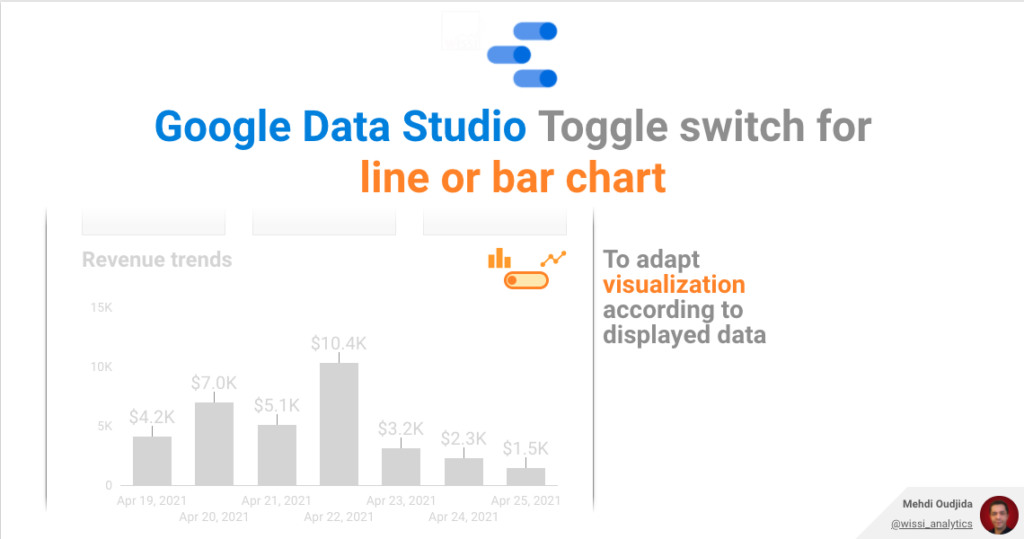
Let’s continue the exploration of Google Data Studio parameter feature with this new example. This time, we will combine parameter
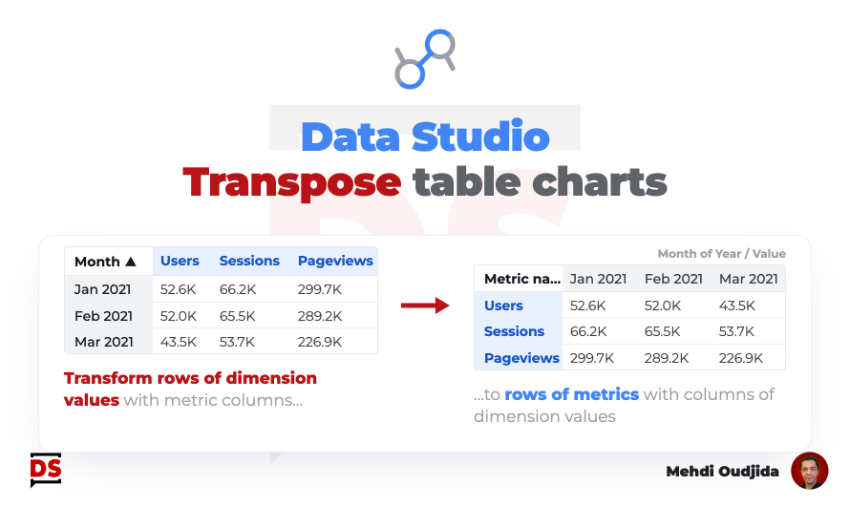
The quick tip below describes how to transpose Data Studio (formerly known as Looker Data Studio) table charts composed with
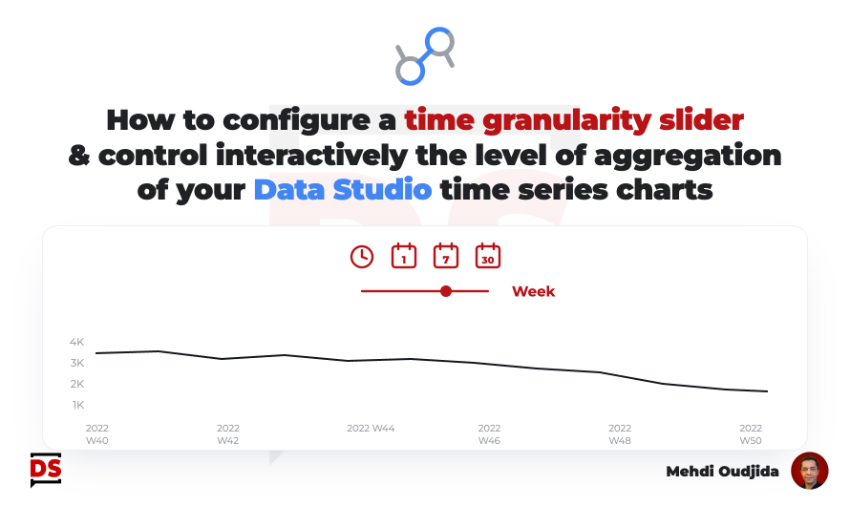
Why building a time granularity slider? I’m really disappointed when Data Studio (ex Looker Studio) reports – made for weekly

Information displayed by default inside an interactive report must be chosen preciously, and it is particularly the case for data
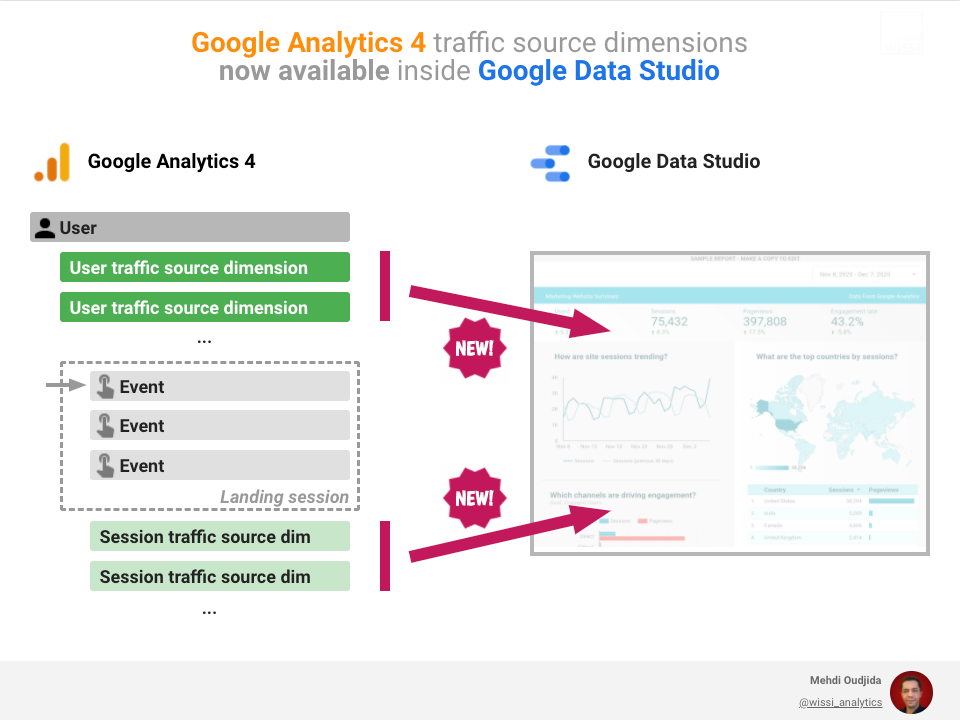
After the addition of user properties, custom dimensions and custom metrics last month, Google Looker Studio team has just rolled

The Looker Studio (ex Google Data Studio) calculated field below returns the remaining number of days until the end of
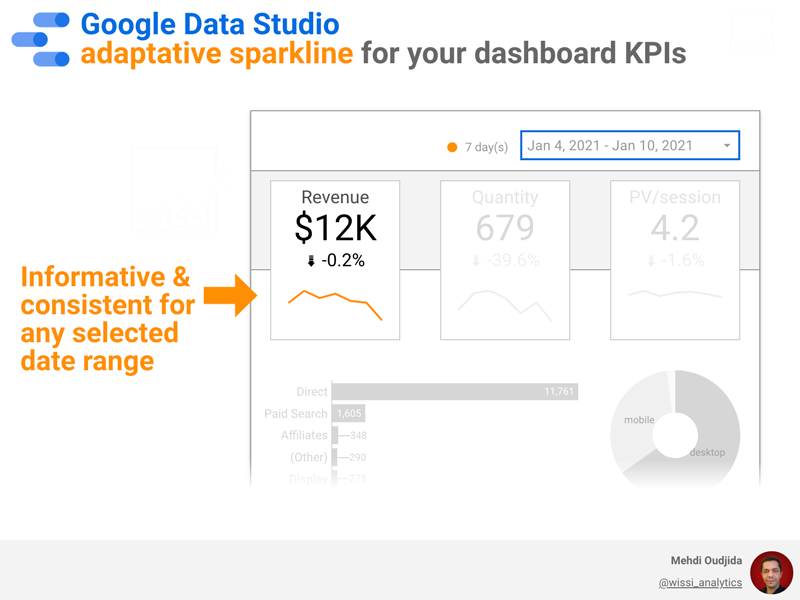
Dashboard KPIs are often enhanced with time comparison (with the previous period or the previous year) as a small score