
How to insert your marketing planning as part of Data Studio trend charts
Few years ago, I wrote a tutorial about how we can include annotations inside Data Studio line charts. My custom
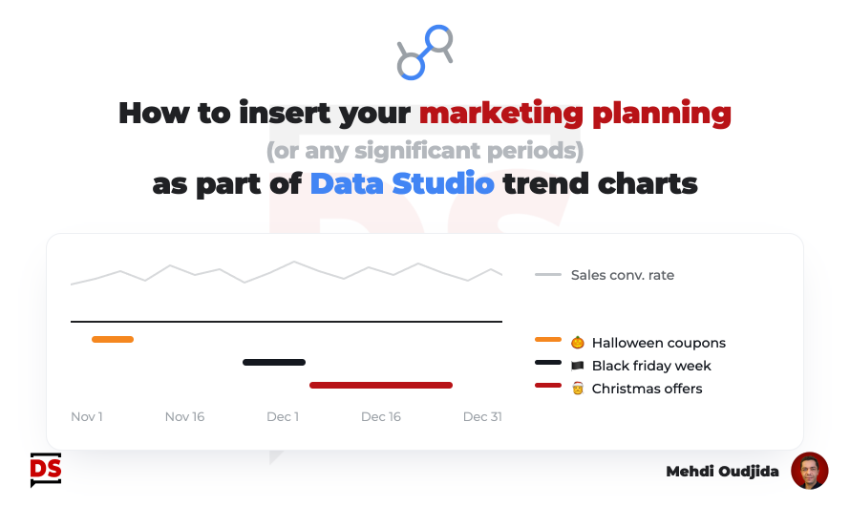
Few years ago, I wrote a tutorial about how we can include annotations inside Data Studio line charts. My custom
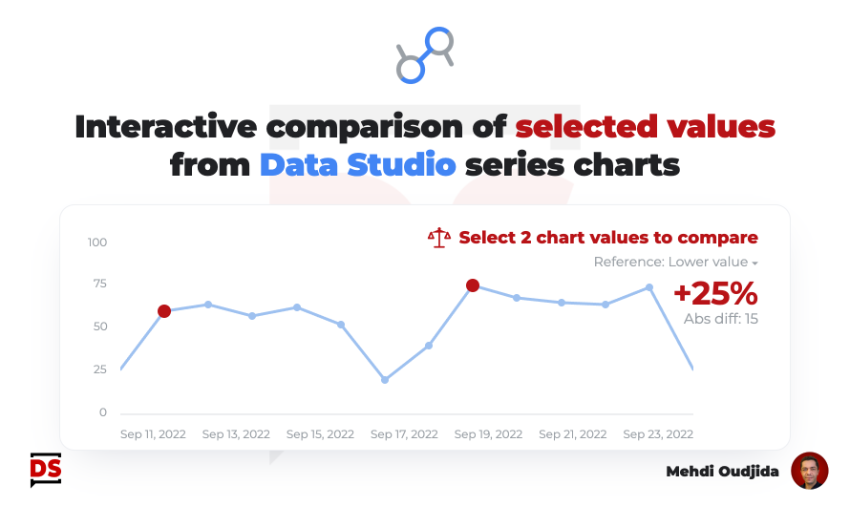
Keeping charts as simple as possible is very challenging. For some cases, a single interactive feature can offer a first
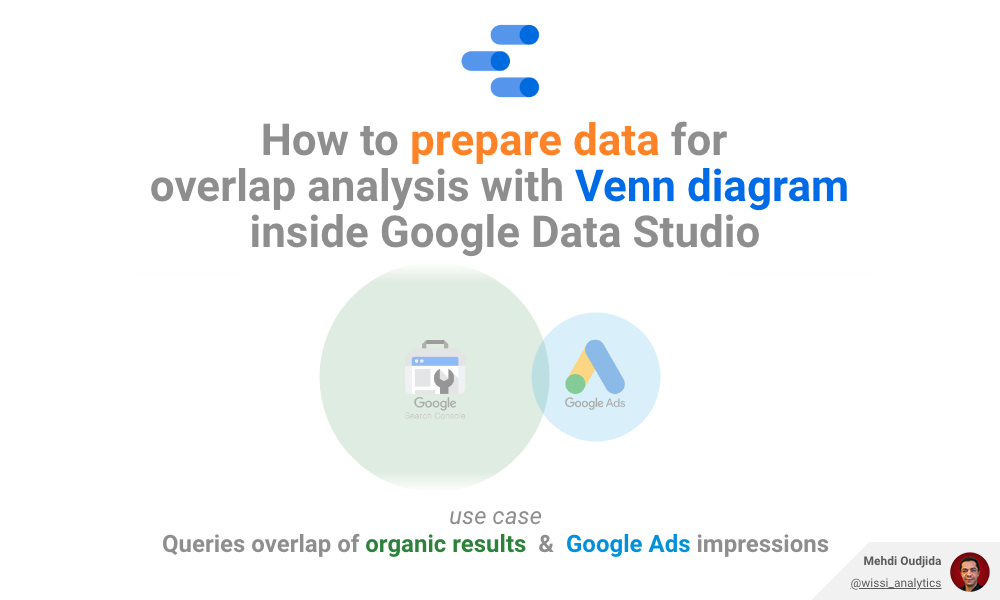
I always prefer preparing data outside Data Studio and I always prefer using builtin chart types when it is possible.
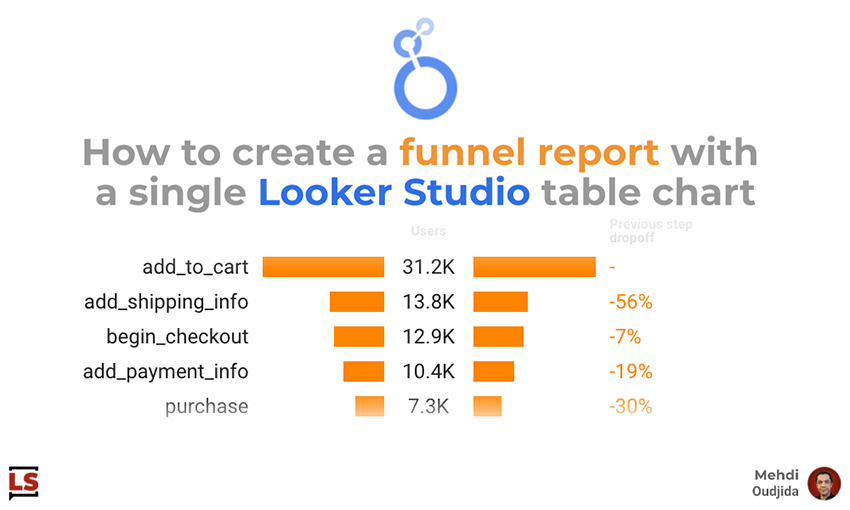
Funnel report type inside Looker Studio, a recurring need for a popular visualization. There are a lot of solutions, templates,
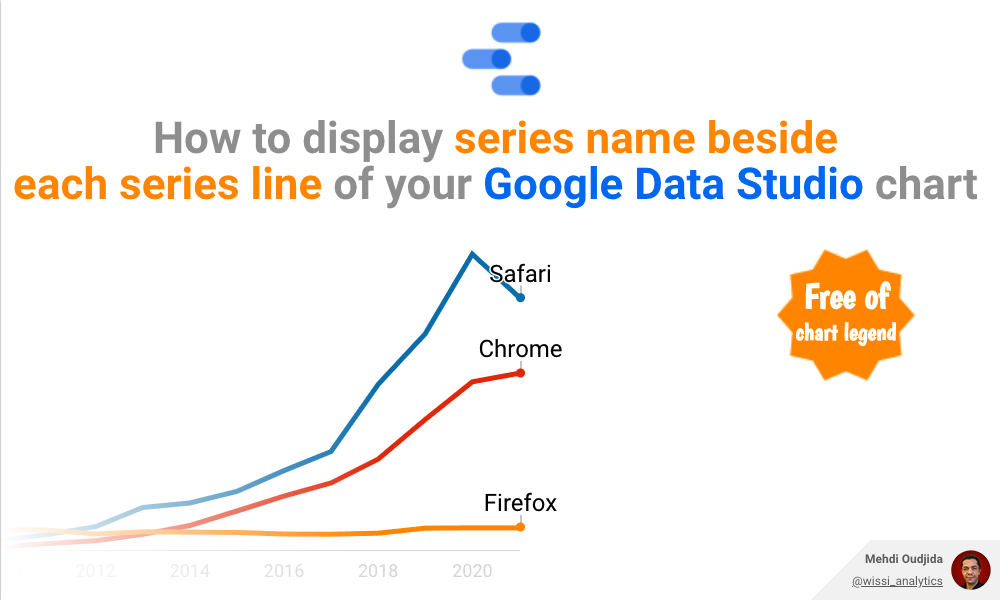
For a lot of cases, legends are not the best visualization solution for line chart (and similar trends chart types).

The Looker Studio (ex Google Data Studio) calculated field below returns the older date from a date dimension. The min
The Looker Studio (ex Google Data Studio) calculated field below returns the most recent date from a date dimension. The
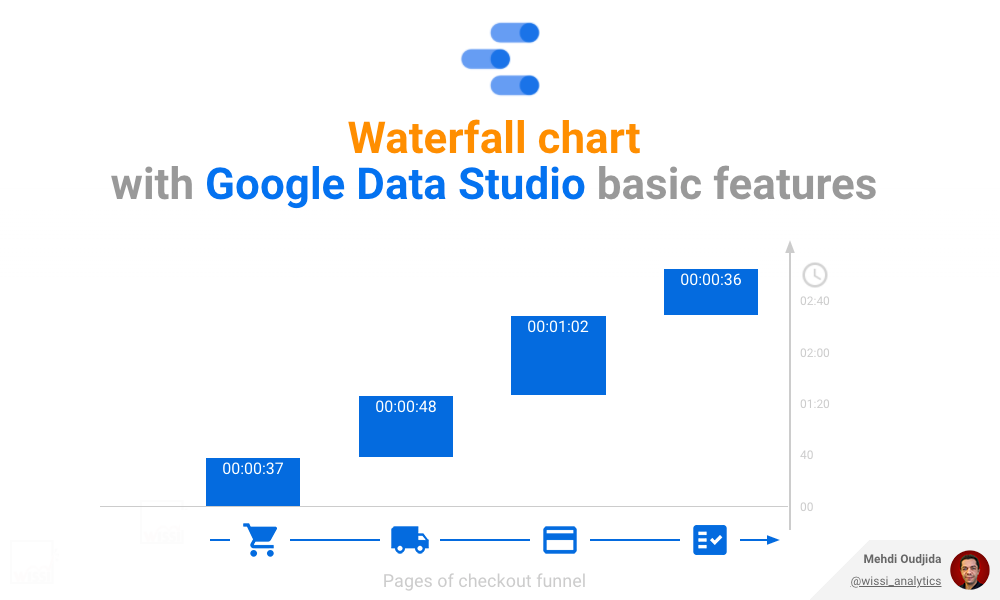
Waterfall charts are nice & efficient to visualize cumulative values of a metric and the related participation weight of each
The Looker Studio calculated field below returns the file name with the related extension from a field providing an absolute
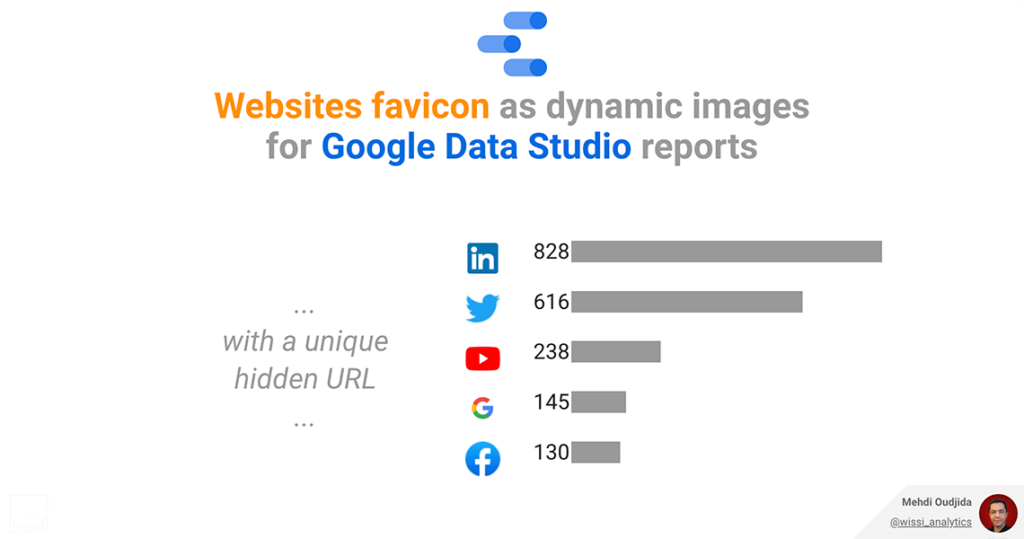
Few months ago, I’ve discovered a nice Google hidden URL thanks to a tweet from Ben Collins about a Google