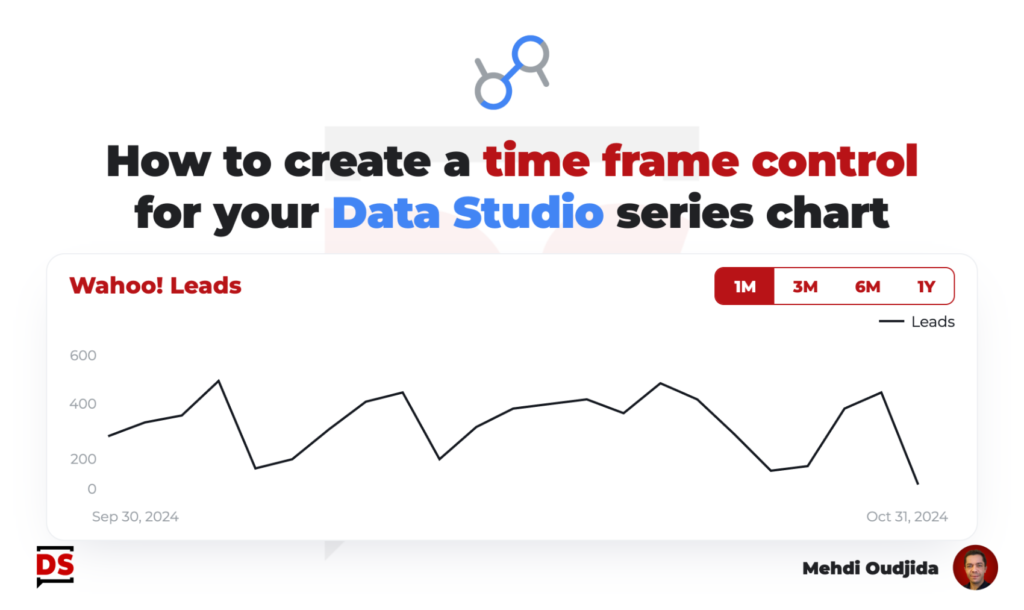
This tutorial describing how to create a time frame control has been inspired by a question from the community. This control is strongly associated to the financial world for stock prices charts.
More generally, when building a dashboard or an interactive report, we often tend to add a date selector. I’m convinced that it’s not often necessary, and sometimes, a simple option to expand the period to larger time ranges is sufficient. This is especially true for dashboards aimed at monitoring performance on a fixed time granularity with defined goals and thresholds.
So let’s see how we can build this time frame control for a line chart.
Unlock free access to the full article
Access to this article written by Mehdi Oudjida, Data Studio Expert, is completely free: enter your email address to receive an access link to the full article.
Your email address is only used to send the link, and for the newsletter if you tick the box. It is not stored on this site.
Alternative for the time frame control: BigQuery custom query
One of the goals of this recipe was to be compatible with any data source. But if your report loads BigQuery data sources, the possibilities will be much broader with a simpler configuration, as usual, relying notably on custom queries. The same principles around the parameters described in my interactive custom date range comparison recipe are used for this case and avoid blending.
Voilà.