Today, I propose you to build a tool for BigQuery.
Google Cloud BigQuery is the best friend of Data Studio. We will not state today all the benefits to consider BigQuery, at least, as the preparation layer of Data Studio reports.
The more you use BigQuery for your data warehouse or just for your visualisation layer, the more you multiply/optimize/factorize your tables for transformation and visualisation purposes.
And often, facing a collection of tables, you need to know quickly (without a complicated graph with tangled relation links) where is a specific data, is it already available and computed as expected, do I need to compute&store it in a lower business layer before taking care of a new table for my visualisation need, etc.
In this kind of situation, the tool described in this article could help. I built it also because I think it is a nice communication support between data engineers, as something you use during a meeting or you change, capture and send in a mail as an element of briefing (“here are the data we need to clean and merge”).
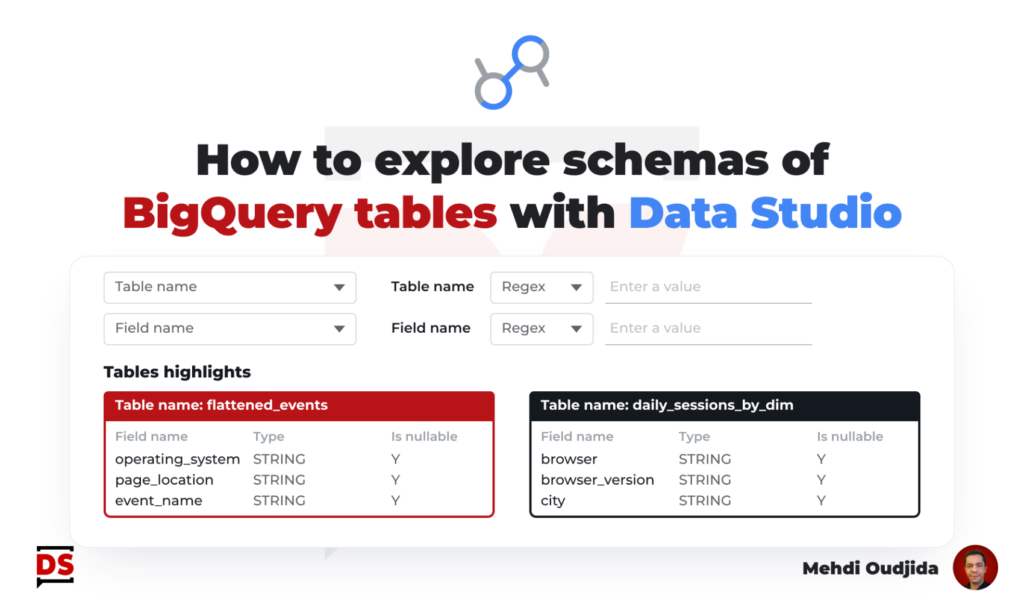
This tool offers to display efficiently BigQuery meta data information of your tables using a specific view of INFORMATION_SCHEMA.
This time, Data Studio will help BigQuery management, providing clear & simple visualisations of your datasets states.
Unlock free access to the full article
Access to this article written by Mehdi Oudjida, Data Studio Expert, is completely free: enter your email address to receive an access link to the full article.
Your email address is only used to send the link, and for the newsletter if you tick the box. It is not stored on this site.