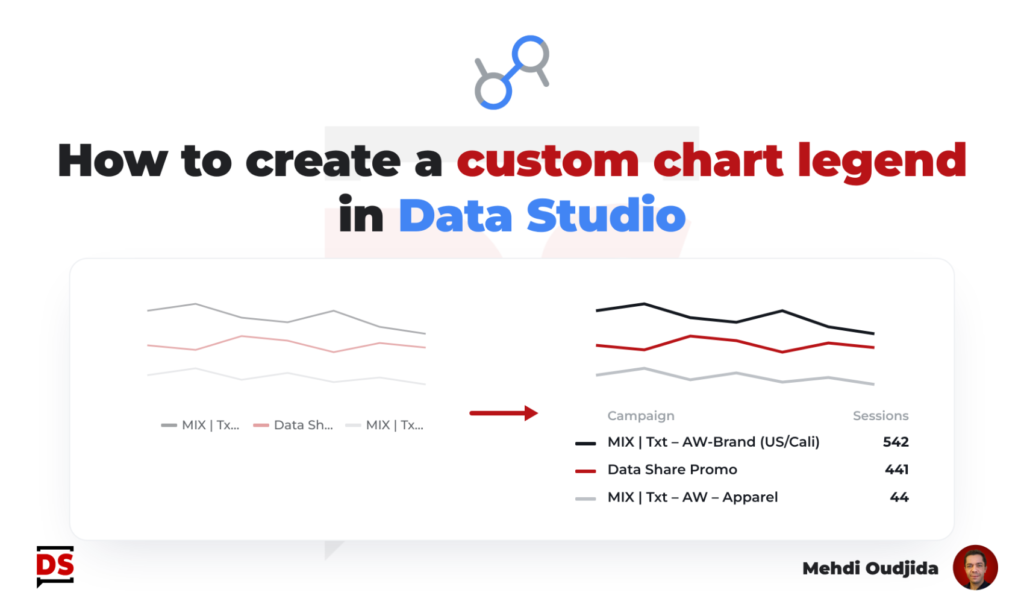
In most cases, built-in chart legend proposed inside Data Studio (formerly known as Looker Studio) addresses our needs. A list of label values corresponding to displayed colors in your chart.
But there are some limitations about chart layout we need to work around to get a satisfying design result. In particular when you wish to put your legend above or below your chart.
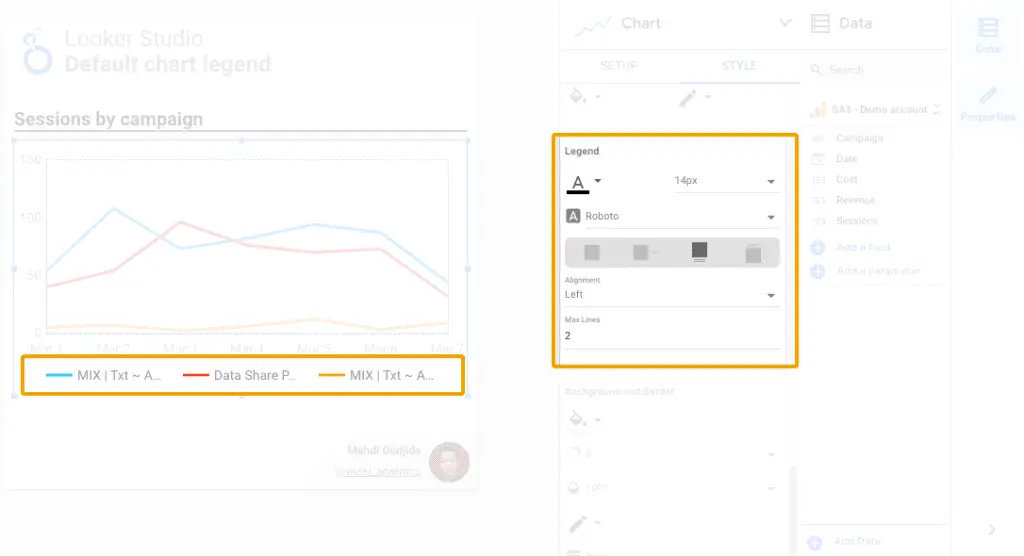
In the following example, I’ve created a time series chart with 3 lines and I will add a corresponding legend just below. Unfortunately, Labels are too long to be display at the bottom of the chart on one line and for the moment, Data Studio doesn’t permit to do it as a list when the legend is at the top or bottom of the chart.
Unlock free access to the full article
Access to this article written by Mehdi Oudjida, Data Studio Expert, is completely free: enter your email address to receive an access link to the full article.
Your email address is only used to send the link, and for the newsletter if you tick the box. It is not stored on this site.