Ready to talk with your data? 🤌🏻 Here a new exciting demo of Looker Studio Pro Conversational Analytics – currently in preview.
Maybe for now, the most promising feature for any data analyst using Looker Studio or Looker.
Use case
My challenge here was to reproduce the automation of generation of chart multiples like inside R Studio with ggplot library. But this time with natural language. Generating several charts in Looker Studio with one prompt is an important time saver when it comes exploring data for analysis tracks identification.
Limitations & workarounds
Multiples are officially not supported by Looker Studio in general, and also by Conversational Analytics for the moment. That was the first answers of my attempts.
BUT! if you adapt your prompts, with progressive steps of AI learning and understanding of your need, the engine combining Gemini, Python (from code interpreter) and the Looker Studio data source loader help you to get what you need. Let’s jump in the demo now.
Data Source
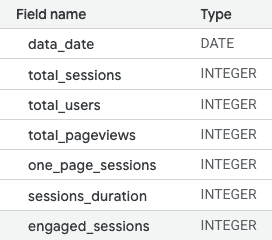
I’ve prepared quickly a simple data set in a BigQuery table and load it as a data source. My main objective was to have a table with a series of metrics broken down by a dimension.
Prompting progressively
Avoiding the concept of “multiples” (working around the rejection of the bot) and giving context to Gemini, as an ally of investigations, I’ve started by checking that the bot is understanding the context.
- ❓ Question: “There are 6 numeric fields in this data source corresponding to my metrics. right?”
- 🤖 Answer: “Yes, there are 6 numeric fields in the data source: total_sessions, total_users, total_pageviews, one_page_sessions, sessions_duration, and engaged_sessions. These fields are of type INT64, which is a numeric type. There is also data_date which is of type DATE.”
…good boy…let’s continue…
- ❓Question: “how many combination of 2 metrics I can do with these 6 numeric fields?”
- 🤖 Answer: “With 6 numeric fields, you can have 15 combinations of 2 metrics. This is calculated as 6 choose 2, which equals 6! / (2! * (6-2)!) = 15 combinations.”
Correct!
- ➡️ Prompt: “Create a scatter chart with one_page_sessions as x-axis, total_sessions as y-axis and data_date values for each plot.”
Thanks to this prompt, I got my first chart as an example to replicate.
Multiples chart generation
And after the final prompt below…
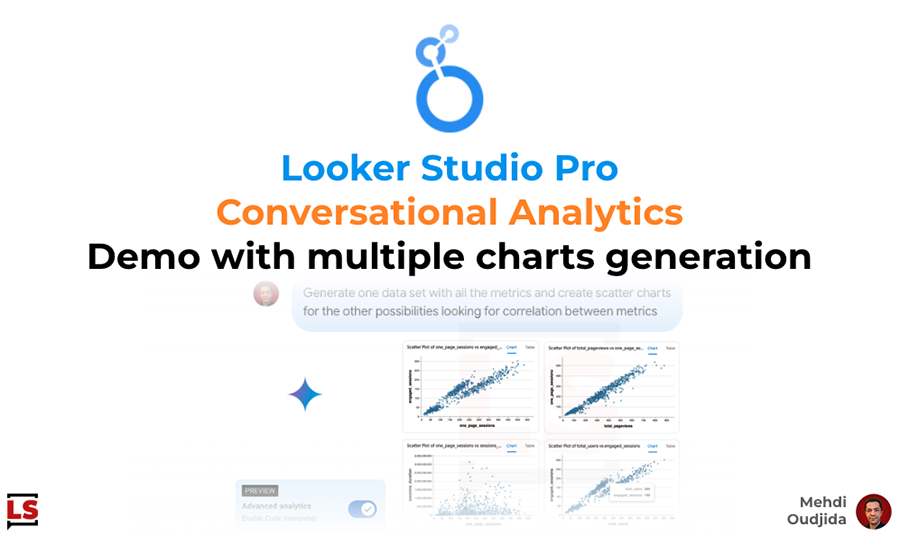
Generate one data set with all the metrics and create scatter charts for the other possibilities looking for correlation between metrics
… boom! I got what I need to go fast! My R-squared-ish visualizations. 15 charts auto generated for my analysis. 😁
Demo video
After the explanations above, I let you watch the silent video below, the best par is when the bot starts to generate multiples with the related progressive data loading.
Conversational Analytics & Code Interpreter
Conversational Analytics is available in preview for Looker Studio Pro users. This feature is under steroids in this demo thanks to the “Code Interpreter”, as part of the Trusted Tester features when I write these lines.
The Code Interpreter is designed to transform your prompt requests into Python code, runs the code, and delivers analyses and visualizations.
For the moment, it is just the beginning of the testing program but the goals and the capabilities are very exciting.
The documentation of the code interpreter is providing the list of the implemented Python libraries.
That’s a perfect indirect information for reverse engineering, to find some hidden insights about the possible results and benefits to expect, thanks to the Python new layer. The new ally of Conversational analytics.
Here what we can expect through this list of Python libraries:
- Computer Vision Pipeline (sequence of visual steps for analyses )
- Deep learning (tensorflow)
- Geospatial Analysis (geopandas)
- PDF and document generation (reportlab,fpdf)
- and of course, Core Data Science (pandas,numpy)
For the moment, it is just speculations, let’s see in the future how go the tests during this preview phase and what Looker and Looker Studio team is preparing to help us analyzing BigQuery & Looker data.
See also the examples of analysis questions in the documentation…very promising too. Excited to test all this with real data sets and business questions, to see Python inside Looker Studio in action.
If this first impressions are confirmed in the future, we can consider Conversational Analytics as a new benefit for a subscription to Looker Studio Pro.