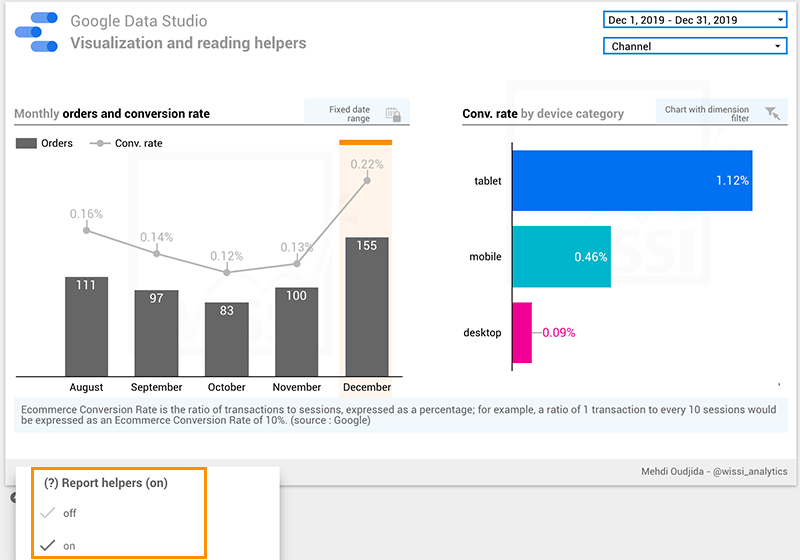
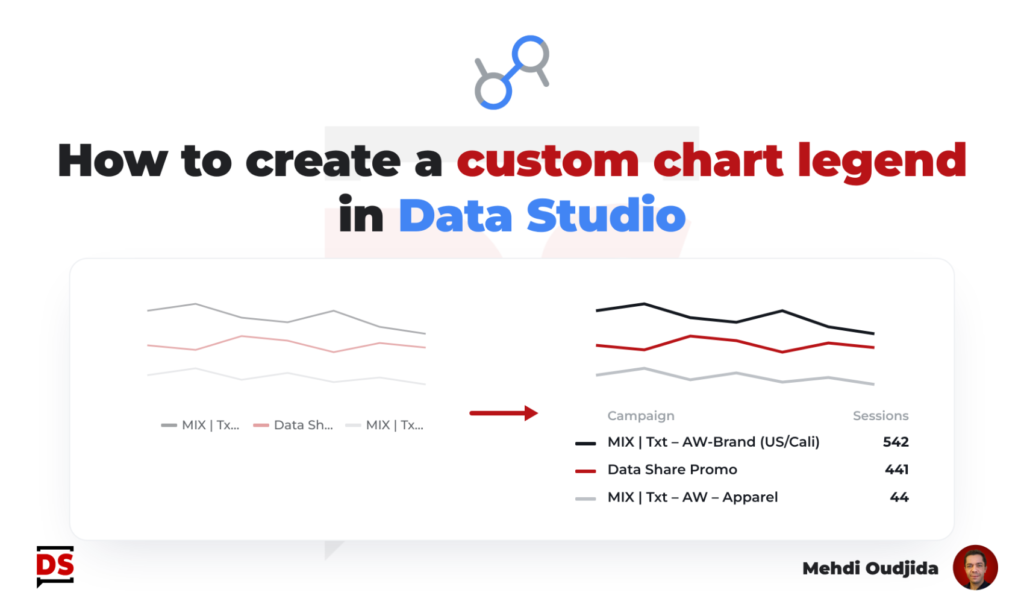
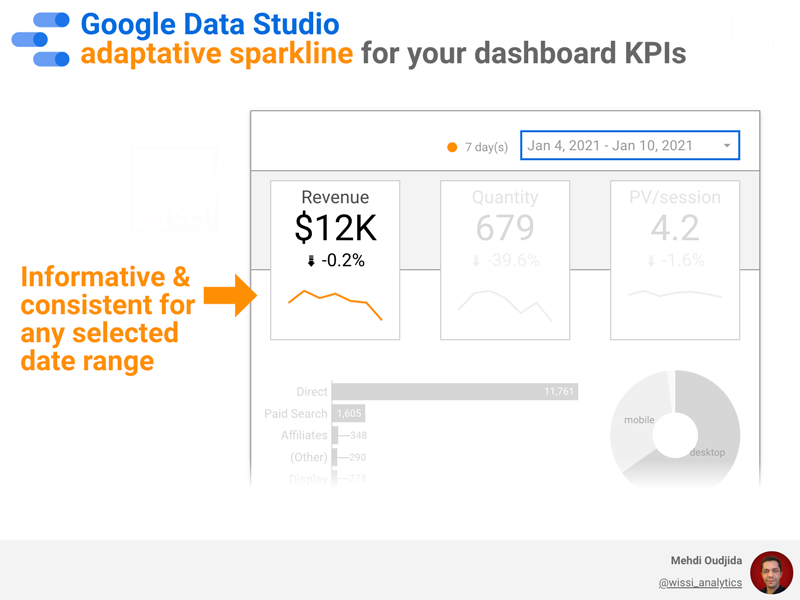
Information displayed by default inside an interactive report must be chosen preciously, and it is particularly the case for data labels in a time series chart.
Commonly, we don’t need to display labels for all points because we read dashboards and reports progressively, using interactivity and control features to get secondary level of information (ex: put the cursor over a data point to get the related value).
So let’s take care of the data-pixel ratio dynamically inside a Data Studio (formerly known as Looker Studio) dashboard, like we do for a presentation. Let’s display only min and max values of a time series chart with a simple home-made solution.
Unlock free access to the full article
Access to this article written by Mehdi Oudjida, Data Studio Expert, is completely free: enter your email address to receive an access link to the full article.
Your email address is only used to send the link, and for the newsletter if you tick the box. It is not stored on this site.