
Google Data Studio – Visualization & reading custom helpers with switch
Few months ago, I’ve written an article introducing some techniques to give data context to your Google Data Studio reports
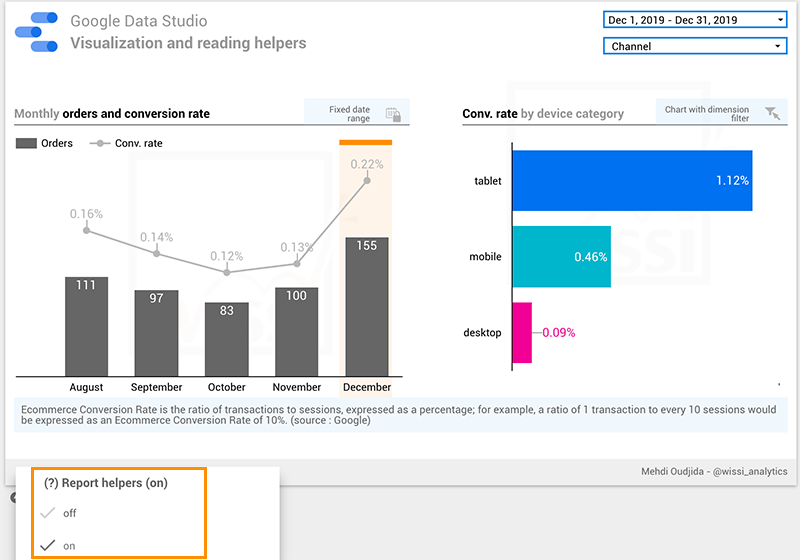
Few months ago, I’ve written an article introducing some techniques to give data context to your Google Data Studio reports
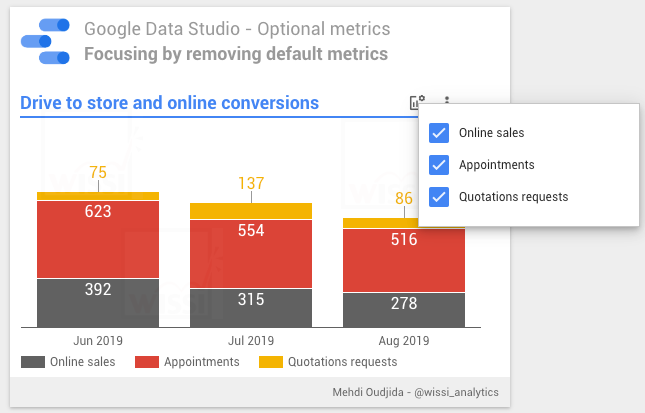
Google Data Studio optional metrics is a nice feature providing possibilities to prioritize metrics comparing to others. Users decide to
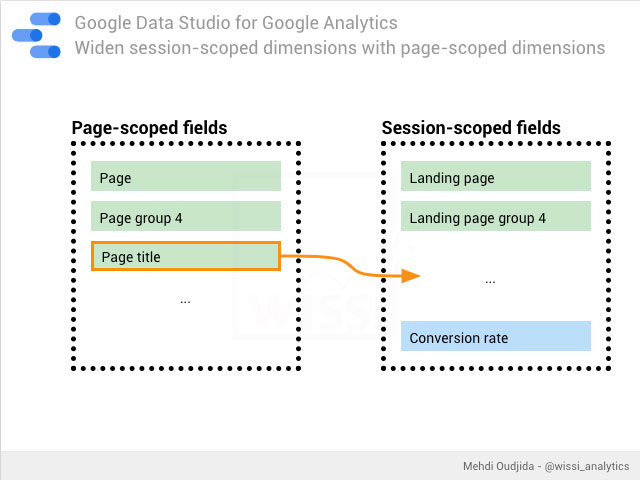
Analytics scopes One of the more complicated concept to adopt inside Google Analytics is dimensions and metrics scopes (User, Session,
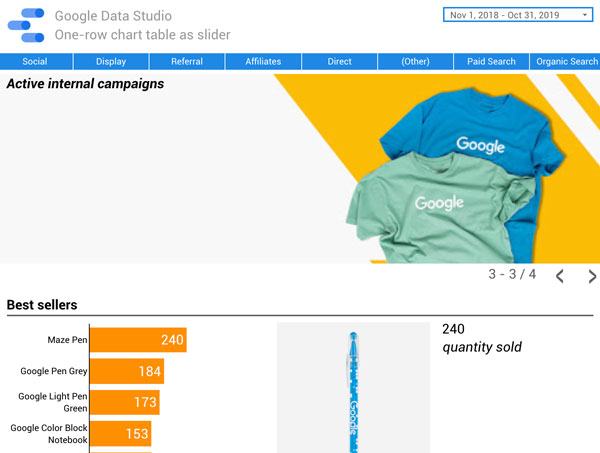
The 22th of October, Google Data Studio team added the option to create table chart with one row per page
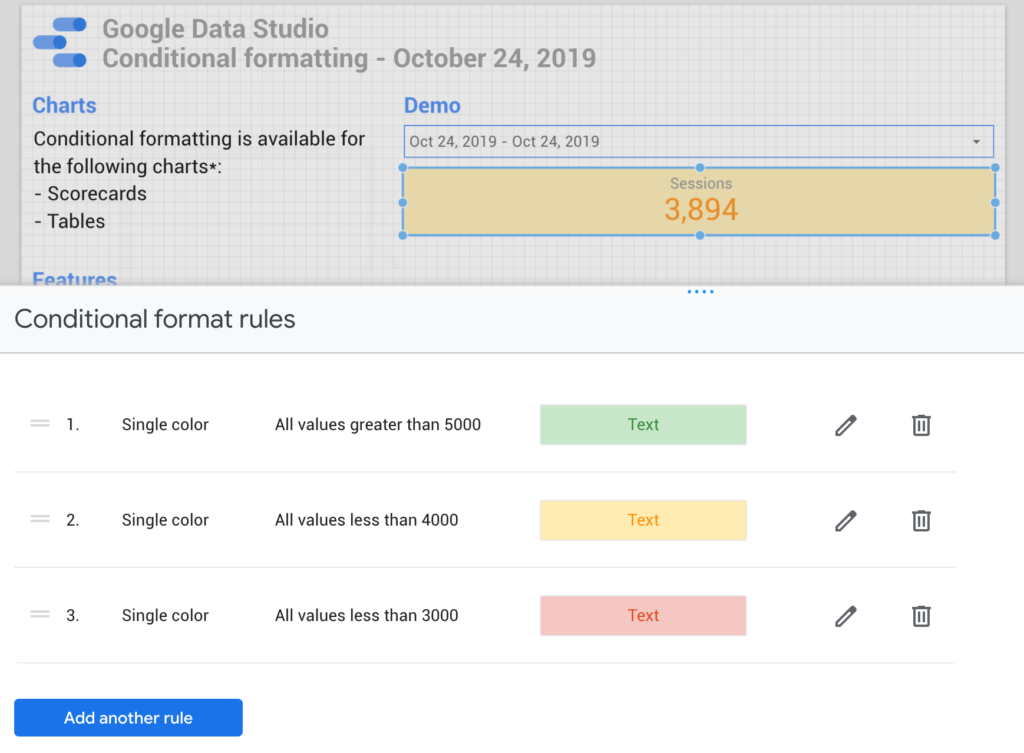
Conditional formatting is the capacity to change styles and data formats following a set of defined rules about manipulated data.
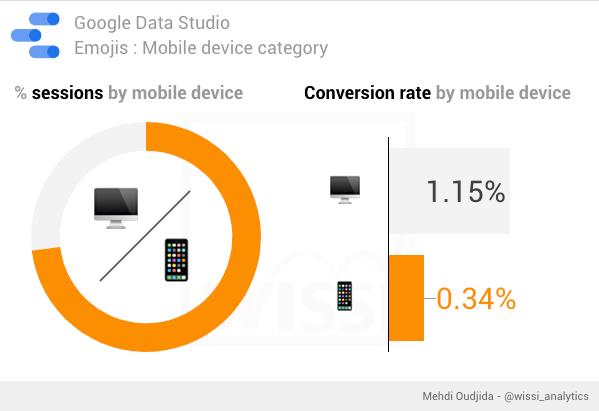
Your situation 💡 Fast and easy solution : EMOJI! 🤗 Emojis compatibilities and access Emojis are system-managed special characters. it
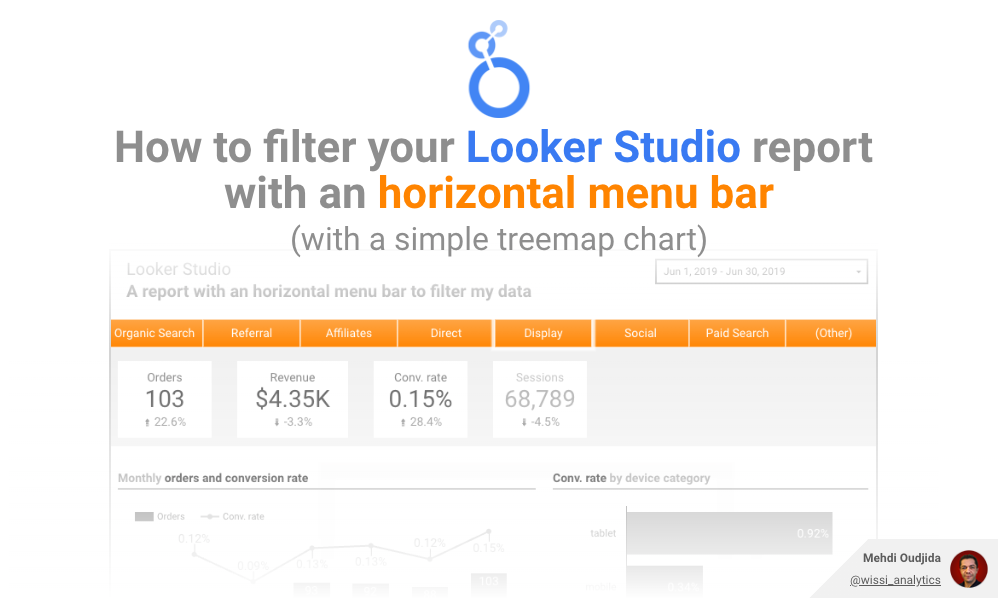
Author edit – November 14, 2022 I wrote this article in July 2019, just after the release of treemap chart
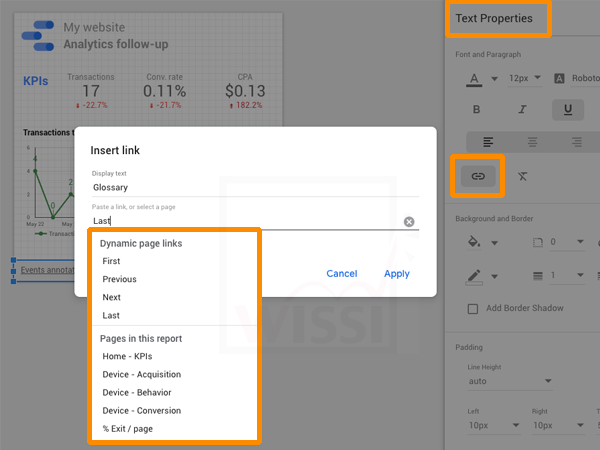
Let’s take care of the readers experiences inside Google Data Studio reports, using text links. The article is based on

The Looker Studio (ex Data Studio) calculated field below returns the number of occurrences of a specific character and use
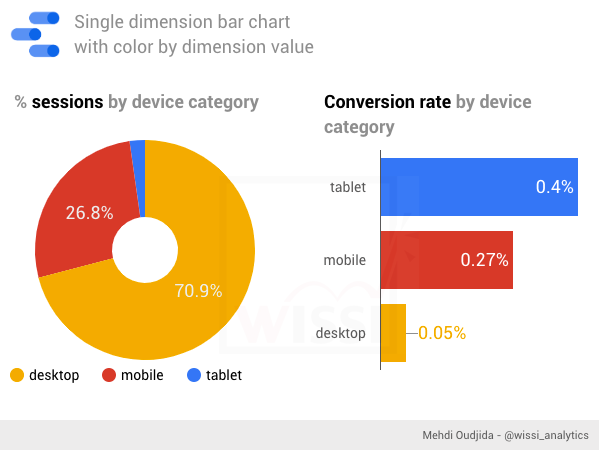
Consistency is key and the easy part of data visualisation. We just need to define some presentation rules and to