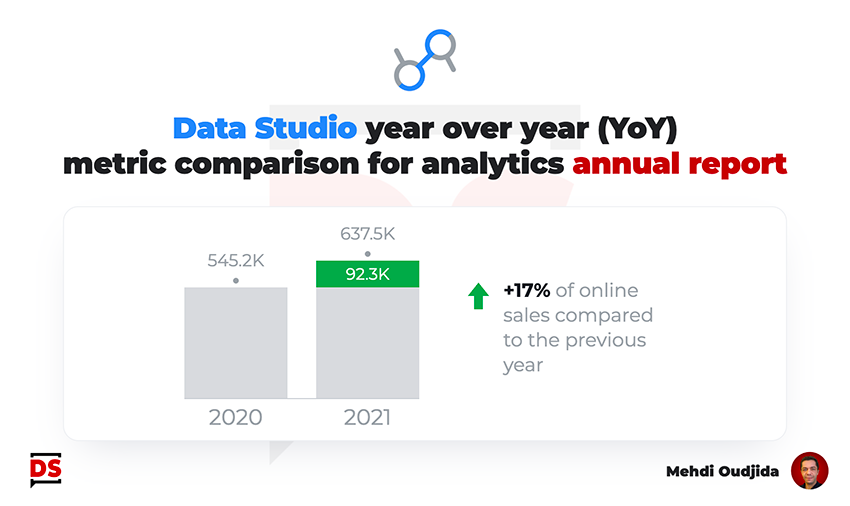
Building a statistics annual report is a nice exercise for challenging the way to display metric values comparison over a granularity of time inside our data visualisation tool.
We could decide to use the default available feature of the tool, through the comparison data range of each chart option inside Data Studio (formerly known as Looker Studio)…we could.
Across this article, we will work towards another visualisation result, getting the full control for narrative purposes about the comparison of a specific metric, year over year (YoY famous acronym in stat reporting vocabulary).
- What is the main message of the report section?
- Which metric needs to be highlighted?
- Which information are less important, just the background of the stage, the data context?
In spite of the fact that we work on an annual report, we can use dynamic data or prepared data according to your data context, and so, use the same visualisation materials next year against minor changes.
But we also consider that we can adapt it manually following the displayed data because the report is not interactive and because there is no strong requirements to keep it dynamically reliable over the time for visualisation purposes. No need to create unnecessary constraints, common sense first.
Unlock free access to the full article
Access to this article written by Mehdi Oudjida, Data Studio Expert, is completely free: enter your email address to receive an access link to the full article.
Your email address is only used to send the link, and for the newsletter if you tick the box. It is not stored on this site.